Download
1 / 36
360 likes | 368 Views
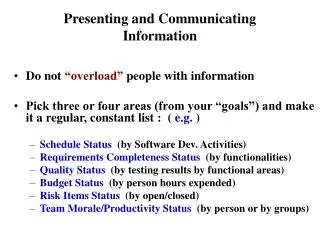
Presenting and Communicating Gender Statistics. Workshop on Gender Statistics Geneva, October 2008. Objective:. Gain skills in data presentation and dissemination to highlight gender issues. Workshop outline. Dissemination vs communication Statistical storytelling

E N D
Presenting and Communicating Gender Statistics Workshop on Gender Statistics Geneva, October 2008
Objective: • Gain skills in data presentation and dissemination to highlight gender issues
Workshop outline • Dissemination vs communication • Statistical storytelling • A journalist’s perspective • Putting it into practice
disseminate –verb (used with object), -nat·ed, -nat·ing. to scatter or spread widely, as though sowing seed; promulgate extensively; broadcast; disperse. Dictionary.com
communicate –verb (used with object) 1. to impart knowledge of; make known: to communicate information. 2.to give to another; impart; transmit. Dictionary.com
dissemination communication
education programs media lobby groups Newspapers Radio Television politicians Internet
Storytelling • What is a statistical story? • Why tell a story? • How to write one
“improve understanding of life in the United Kingdom, and enable informed decisions through trusted, relevant, and independent statistics ” Why tell a story? • Mandate is to inform • Demonstrate the relevance of data
Considerations • Inform and initiate discussion • Accurate information • Independent and unbiased • Guarantee confidentiality • Consider vulnerable groups
To achieve this we must… • Know what is going on in the world • Communicate with users of statistics • User surveys • Focus groups • Meet with users • Monitor website usage and call centre enquiries
What’s the story? Technical report released today New survey results now available Women and Men publication now on-line The results and findings are the story
Identify a theme • International days • Year of the …. • Current events • Holidays • Half-way to MDG deadline • A series on “The way we live now”
Source: http://www.unis.unvienna.org/unis/en/calendar_days_weeks_08.html
Conclusions Idea Analysis Dataset Dataset Analysis Idea Conclusions Writing tips 1. Write like a journalist: “inverted pyramid style”
Writing tips • The first paragraph is the most important. It should: • Send a clear message • Grab the reader’s attention • Contain few or no numbers • Be short and to the point • Focus on 1-2 findings
Poor: A new study probes the relationship between parental education and income and participation in post-secondary education from 1993 to 2001. Good: Despite mounting financial challenges during the 1990s, young people from moderate and low-income families were no less likely to attend university in 2001 than they were in 1993.
Poor: Latest figures on information technology usage show that in the 1st quarter of 2008, two thirds of Estonian population aged 16–74 used computers and the Internet, as in the previous year. Better: Two thirds of Estonian adults used the Internet in recent months.
Activity – the lead paragraph • Read through the paragraph allocated to your group • Work on your own for 5 minutes to come up with a better example • Discuss these in your groups and agree on a final lead paragraph
Lessons learned • It takes time to come up with a good lead paragraph • There is no contradiction between getting attention and being accurate • Which key points to highlight depends on the message you want to send • Lead paragraph can be followed by more details that explain the findings
Writing tips • Language that people understand • Short sentences, short paragraphs • One main idea per paragraph • Subheadings • Bulleted lists for easy scanning • Rounded numbers
Things to avoid • “Elevator statistics” • Jargon and technical terms • Acronyms • All capital letters and all italics • “Table reading”
Headlines • Be informative, appealing, magnetic, interesting and newsy • Attract the reader • Most important finding • One line of type • Not try to tell everything • Contain few numbers, if any at all
Not good: • New report released today • Energy conservation measures widespread • Prices up in domestic and import markets Good: • Gasoline prices hit 10-year low • Crime down third year in a row • July oil prices levelled off in August
Activity - the headline • There are two press releases with the headline removed • What do you think would make a good headline? • Work on your own for a few minutes • Then discuss it in your groups
Lessons learned • Message that will attract the reader may not be what you think is the most important finding • Statistical information can fit a range of themes
Summary • Dissemination vs communication • Why tell a story? • Remember themes and news • Write like a journalist • Lead paragraph • Headline