Download
1 / 43
430 likes | 810 Views
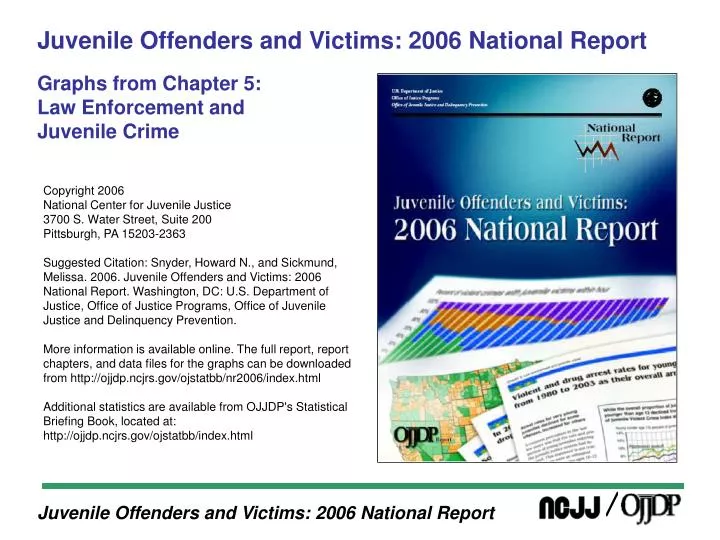
Juvenile Offenders and Victims: 2006 National Report Graphs from Chapter 5: Law Enforcement and Juvenile Crime. Copyright 2006 National Center for Juvenile Justice 3700 S. Water Street, Suite 200 Pittsburgh, PA 15203-2363

E N D
Juvenile Offenders and Victims: 2006 National ReportGraphs from Chapter 5: Law Enforcement andJuvenile Crime Copyright 2006 National Center for Juvenile Justice 3700 S. Water Street, Suite 200 Pittsburgh, PA 15203-2363 Suggested Citation: Snyder, Howard N., and Sickmund, Melissa. 2006. Juvenile Offenders and Victims: 2006 National Report. Washington, DC: U.S. Department of Justice, Office of Justice Programs, Office of Juvenile Justice and Delinquency Prevention. More information is available online. The full report, report chapters, and data files for the graphs can be downloaded from http://ojjdp.ncjrs.gov/ojstatbb/nr2006/index.html Additional statistics are available from OJJDP's Statistical Briefing Book, located at: http://ojjdp.ncjrs.gov/ojstatbb/index.html
Between 1980 and 2003, the female percentage of juvenile violent crime arrests increased, with the overall increase tied mainly to aggravated assault arrests
The female percentage of juvenile arrests increased between 1980 and 2003 for each of the four Property Crime Index offenses
Between 1980 and 2003, the female proportion of juvenile arrests increased for simple assault, vandalism, and weapons offenses
Between 1980 and 2003, the female proportion of juvenile arrests increased for liquor law and curfew violations; drug abuse violations increased from 1991 to 2003
While the overall proportion of juvenile arrests involving youth younger than age 13 declined from 1980 to 2003, their proportion of juvenile Violent Crime Index arrests grew from 6% to 9%
The proportion of juvenile Property Crime Index arrests involving youth younger than age 13 declined from 16% in the late 1980s to 11% in 2003
Between 1980 and 2003, the proportion of juvenile arrests involving youth younger than age 13 increased for weapons and sex offenses
Between 1980 and 2003, the proportion of juvenile arrests involving youth younger than age 13 increased for drug offenses and disorderly conduct
By 2003, the juvenile Violent Crime Index arrest rate had fallen to the levels of the late 1980s
The arrest rate for murder in 2003 was the lowest since at least 1980 for white, black, male, and female juveniles
Between 1991 and 2003, the juvenile arrest rate for forcible rape fell 46%, with a larger decline in the black rate than the white rate
Between 1980 and 2003, the annual juvenile arrest rate for robbery declined substantially, even though a period of growth was embedded in the trend
The large growth and subsequent decline in the juvenile arrest rate for aggravated assault between 1980 and 2003 illustrate the volatility of juvenile violence levels over the timeframe
The juvenile arrest rate trend for Property Crime Index offenses is used as a general barometer of all property crime arrests of juveniles
Juveniles in 2003 were far less likely to be arrested for burglary than juveniles 25 years earlier (i.e., their parents’ generation)
The juvenile arrest rate for larceny-theft fell in 2003 to its lowest level since at least 1980
The juvenile arrest rate for motor vehicle theft in 2003 was less than half the level a decade earlier
The juvenile arrest rate for arson in 2003 was back to the levels of the early 1980s
Unlike other crimes against persons, the juvenile arrest rate for simple assault did not decline substantially after the mid-1990s
Other (simple) assault arrest rate trends by gender and race
The juvenile arrest rate trend for weapons law violations generally paralleled the trends in juvenile violent crime arrests
The surge in the juvenile arrest rate for drug abuse violations between 1993 and 1997 occurred during a period when the juvenile violent crime arrest rate was declining
After increasing in the mid-1980s to mid-1990s, the juvenile proportion of violent crimes cleared by arrest or exceptional means did not return to its earlier levels
The juvenile share of property crime has fallen substantially since 1980
Clearance statistics imply that juvenile involvement in each of the violent offenses in 2003 was less than it was 10 years earlier
In 2003, the juvenile shares of clearances for burglary, larceny-theft, and motor vehicle theft were at their lowest points in more than 20 years
Among states with at least minimally adequate reporting, those with high juvenile violent crime arrest rates in 2003 were Delaware, Florida, Maryland, Pennsylvania, and New Jersey
Juvenile violent crime arrest rates varied considerably among counties within a state in 2002
The states of Wisconsin, Utah, Alaska, Montana, Idaho, Florida, Washington, and Colorado reported the highest juvenile Property Crime Index arrest rates in 2003
In 2002, counties within a state varied considerably in their juvenile Property Crime Index arrest rates