Phase II WIP Background & Development Process
190 likes | 348 Views
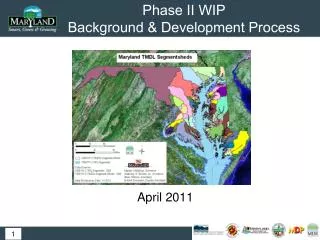
Phase II WIP Background & Development Process. April 2011. 1. Basic Background on Clean Water Act and Total Maximum Daily Loads (TMDLs) Background on the Bay TMDL and Watershed Implementation Plans (WIPs) Discuss the Phase II WIP Development Process. Presentation Overview. 2.

Phase II WIP Background & Development Process
E N D
Presentation Transcript
Phase II WIP Background & Development Process April 2011 1
Basic Background on Clean Water Act and Total Maximum Daily Loads (TMDLs) Background on the Bay TMDL and Watershed Implementation Plans (WIPs) Discuss the Phase II WIP Development Process Presentation Overview 2
1972 federal Clean Water Act Requires: Water Quality Standards Assessment (monitoring) of Waters Identification of Waters that Violate Standards 303(d) List of Impaired Waters Identify Pollutant(s) Causing Impaired Waters Set Limits on Pollutants: Total Maximum Daily Load Write Permits to be Consistent with TMDLs Basic TMDL Background 3
Main Concepts of a TMDL: TMDL: Maximum amount of pollutant that can be received by a water body and still meet standards. TMDL Allocates loads among sources and geographic areas. TMDL = WLA + LA + MOS WLA: Sources with Permits (point sources) LA: Sources without Permits (nonpoint sources) MOS: Margin of Safety, protective of environment. TMDL is usually determined by a scientific study of the water body, often using computer models. Total Maximum Daily Load 4
Court Settlement: Required Chesapeake Bay TMDLs to be completed by December 2010 EPA Led a Regional TMDL Development Process Sets limits, by State, on Nutrient & Sediment Pollution EPA Required “Watershed Implementation Plans”: Allowed States to Allocate Loads Supports “Reasonable Assurance” of Implementation Part of new federal “Accountability Framework” to Ensure Results 58 Separate Segments have TMDLs in Maryland Bay TMDL Background 5
Examples of impaired segments. • Appendix B2 of Phase I WIP 6
Federal “Accountability Framework” Clean Water Act: Bay TMDLs and generally greater regulatory influence Watershed Implementation Plans 2-Year Implementation Milestones Tracking & Evaluating Progress Federal “Consequences” What is Different than Previous Bay Restoration Efforts? 7
Events that could Trigger Consequences include failure to do any of the following: Develop and submit Phase I, II and III WIPs; Develop two-year milestones; Achieve two-year milestones; Develop appropriate mechanisms to ensure that non-point source load allocations are achieved. Develop National Pollutant Discharge Elimination System (NPDES) permits consistent with the waste load allocations of the Bay TMDL Federal Consequences 8
Possible Consequences: Expand NPDES permit coverage to currently unregulated sources; Object to NPDES permits, increase program oversight; Require net improvement offsets; Require additional reductions from point sources; Increase and target federal enforcement and compliance assurance; Condition or redirect EPA grants; and Federal promulgation of local nutrient water quality standards. Federal Consequences (Con’t) 9
Three-Phased Planning Process: Phase I Plans - 2010 Nutrient and sediment target loads by sector and impaired segment Statewide strategies for reducing loads in each source sector Starting Point for Phase II Plans Phase II Plans – 2011/12 Refined EPA Watershed Model Results Divide loads by smaller geographic areas More detailed strategy to meet 2017 Interim Target - 70% reduction 2-Year Milestone actions for 2012-2013 Phase III Plans – 2017 Modification of TMDL and allocations, if necessary Identify changes needed to meet Final Target loads Watershed Implementation Plans 10 10
Continue Upgrades of Major WWTPs Leaves Room in WWTPs for Smart Growth Upgrade Septic Systems in Critical Area Reduction Deadlines for Phase I & Phase II MS4 Stormwater Permits plus New Flexibility Many new Agricultural Practices. Offset Program for Septic & Development Loads by 2013 (account for growth in loads) Highlights of Phase I WIP 11
Conceptual Approach: Incentives to Promote Smart Growth Proposes Three Types of Geographic Areas: Offsets tighter in lower density areas, that is, areas of high per-capita loads. Option for Local Alternative Approach Trading System is Essential Element Being Developed via Statewide Workgroup Parallel to, but separate from, Phase II WIP. Schedule Envisions 2013 Implementation Accounting for Growth in Loads 12
To avoid getting lost in the details… … lets boil it down to the three basics: Allocations: For the major source sectors 2-Year Milestone Commitments for 2012 & 2013: Implementation Actions Program Development Actions 2017 Interim Strategy: Plausible actions for achieving 70% of the Final Target by 2017. Implementation Actions Program Development Actions Phase II: Bottom Line 13
Agriculture: Expanding & Adding Programs Municipal Wastewater: Major ENR upgrades Minor Upgrades? Some have been proposed. Stormwater: Phase I & II MS4s: Target has been set in Phase I WIP Opportunities for alternative reductions in near term Septic Systems: An approach has been proposed in Phase I WIP Consider alternative reductions Other:Industrial sources, Atmospheric… Break it Down by Sector 14
Industrial stormwater permits May be more stringent, Possibly increased compliance inspections. Allocation for growth If you are involved in new development may need to offset new loads, or May generate a credit for re-development with new stormwater controls where there weren’t any before. Other discharges likely more stringent. Bottom Line for BPA
Interim & Final Target Loads Strategies to Meet Targets Strategy Narrative Load Reduction Analysis (& Gap Analysis) Cost Estimate & Strategy to Address Funding Gap Schedule for “Program Development” (Including Funding) Contingency Strategies Tracking, Reporting and Verification Accounting for Growth in Loads Capacity Analysis & 2-Year Milestones Basic Expectations of WIP 16
EPA completes two agreed-upon changes to Watershed Model, and finalizes N, P and sediment allocations by July 15, 2011 Preliminary 2012-2013 milestone commitments submitted to EPA for scenario analysis by September 30, 2011 (MDE needs Sept.1). Current Draft Dates
Draft Phase II WIPs submitted to EPA by December 1, 2011(MDE needs Nov. 1) 2012-2013 milestone commitments submitted to EPA by January 3, 2012 Public comment probably February, 2012 Final Phase II WIPs submitted to EPA by March 30, 2012 Current Draft Dates
State staff will be assigned to serve as liaisons between each local team and the State agencies. The liaison’s functions are outlined below. Coordinate Local Team Meetings: Schedule Meeting, Set Agenda, Etc. Facilitate Meeting Discussions Explain and Guide the Process: Timelines, Goals, Outcomes/Products Liaison is NOT a WIP Expert: Coordinate Between Local Team & State Agencies: Seek answers to local questions Bring in subject area experts Facilitate other State & federal technical assistance State Liaisons 19