Download
1 / 15
150 likes | 192 Views
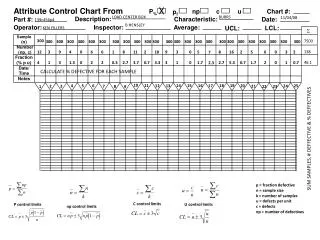
Control chart for fraction defective. Used for: Monitoring Rejection rate, Absenteeism, etc. 1. Collect data. number of items inspected n i number of defective items r i Organize into subgroups. Example:. 2. Calculate fraction defective for each subgroup.

E N D
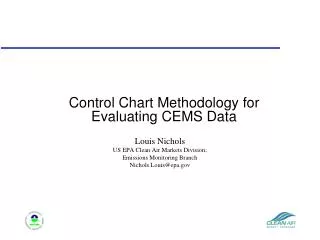
Control chart for fraction defective Used for: Monitoring Rejection rate, Absenteeism, etc
1. Collect data • number of items inspected ni • number of defective items ri • Organize into subgroups
4. Calculate the control limits LCL is not applicable when <0
5. Check if all points within control limits? • If YES, continue to use pbar for future data • If NO, eliminate that data point and recalculate control limits
6. Draw the control chart. If LCL<0, let LCL=0 Note that control limits are constant if n is constant.
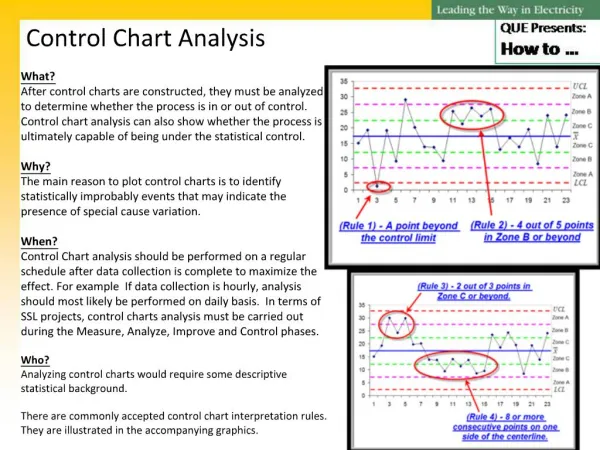
7. Examine for patterns • Any run, trend, or non-random pattern could signal an assignable cause
8. Continue to use for future • pbar can be kept constant, • or pbar can be varied to include the next sample
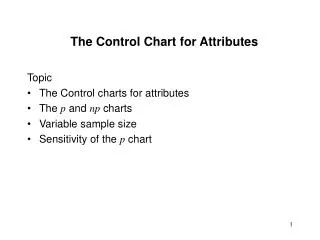
Variable sample size problem - alternatives • Control Limits based on Average Sample Size • Standardized Control Chart
Service applications • No of cheques with errors • No of Purchase Orders with mistakes • No of invoices not paid in time • No of workers absent
Conclusion: • Control chart for fraction defectives can be used to monitor countable data