Download
1 / 21
210 likes | 289 Views
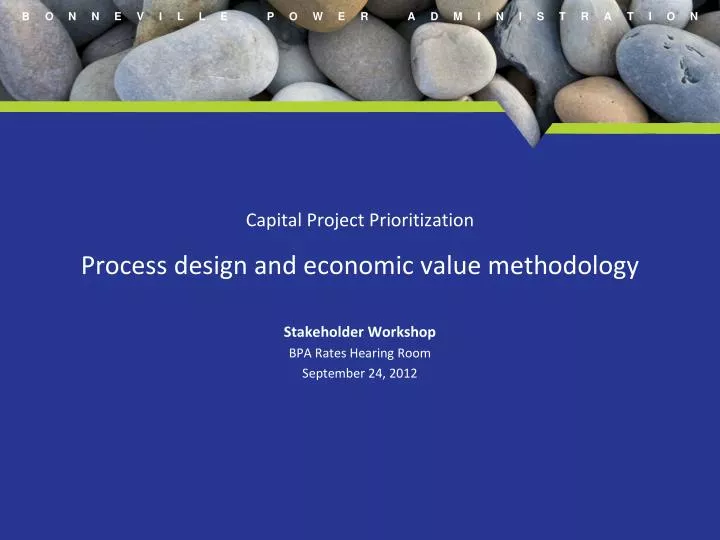
Capital Project Prioritization Process design and economic value methodology Stakeholder Workshop BPA Rates Hearing Room September 24, 2012. Background.

E N D
Capital Project Prioritization Process design and economic value methodology Stakeholder Workshop BPA Rates Hearing Room September 24, 2012
Background • BPA and its FCRPS partners face growing investment requirements to replace and modernize aging infrastructure, add transmission capacity to meet loads and integrate generating resources, and meet regional commitments for energy efficiency and fish and wildlife restoration • At the same time, BPA’s access to low cost sources of capital isconstrained • BPA lacks an agency-wide method to prioritize diverse investments. A systematic, value-based method for prioritizing capital investments across business units is a leading practice among top performing utilities • During the 2012 Capital Investment Review, BPA proposed to develop an agency method for prioritizing investments • Two workshops were held to discuss alternative approaches and a timeline • Stakeholders then submitted comments and recommendations for BPA’s use in developing its methodology • Since then, BPA has hired a consulting firm and formed a cross-agency team to design and develop an agency-wide prioritization process. This includes three phases: • Phase 1 - Process and methodology design - August/September 2012 • Phase 2 - Test/Prove and prepare for implementation - September 2012 - February 2013 • Phase 3 - Begin implementation - March 2013 • The purpose of today’s workshop: • Provide an overview of BPA’s proposed agency-wide prioritization process and methodology • Obtain feedback on the design before we begin testing and preparing for implementation
Background (2) • As designed, the prioritization process can be used to both inform the level and composition of capital budgets and optimize the implementation of budgets as conditions change • BPA is concerned that reductions in discretionary but high-value investments may lead to a sub-optimized system over time -- with higher risks and lower long-term value for stakeholders • The analytical results of this process will enable better-informed decisions on the level and composition of the investment program -- but insights from this new process may or may not lead to large changes in the level of capital spending • BPA will strive to use this new process to balance investment needs, power and transmission rate effects, and access to low-cost capital
Goals Create an agency-level process that: • Furthers the agency’s strategic priorities/objectives • Provides a “level playing field” for projects with different risk/cost/benefit characteristics from various asset categories • Optimizes the agency’s investment portfolio within capital, labor, rate, and other constraints • Ensures decision-making is risk-informed and supported by thorough analysis • Provides transparency both internally and externally • Enables efficient, timely decision making • Enables BPA to track the performance and measure the realized value from investments The methodology and process will be directed at maximizing the long-term operational and economic value of assets. BPA’s Capital Allocation Board (CAB) serves as the executive steering team for this project. (From charter)
Which investments are covered by the new prioritization process? Prioritized through asset strategies, not through new prioritization process Prioritized through new prioritization process “Core” Sustain Investment Reinvestment in existing assets to maintain system performance and capability Expansion and “Non-Core” Sustain Investment Investment that “grows” the asset base, i.e., adds capacity or new capabilities, or that increases operational output or productivity. Also includes sustain investment that is “non-core” Compliance – 3 years Investment must occur in next 3-years in order to comply with contract, order, or directive Policy Commitment – 3 Years Investment must occur next 3 years to fulfill commitments made by the agency Discretionary -3 years Investment that may be valuable, but can be deferred Funded with remaining capital that the agency has budgeted Funded first We estimate that about 40 percent of the agency’s planned capital program is “core sustain”, 50 percent is expansion, and 10 percent is non-core sustain
What is meant by “core” sustain investment? Why are these investments excluded? Prioritized through new prioritization process Prioritized through asset strategies “Core” Sustain Investment Reinvestment in existing assets to maintain system performance and capability Expansion and “Non-Core” Sustain Investment Investment that “grows” the asset base, i.e., adds capacity or new capabilities, or that increases operational output or productivity. Also includes sustain investment that is “non-core” Compliance – 3 years Investment must occur in next 3-years in order to comply with contract, order, or directive Policy Commitment – 3 Years Investment must occur next 3 years to fulfill commitments made by the agency Discretionary -3 years Investment that may be valuable, but can be deferred Funded first Funded with remaining capital that the agency has budgeted Core Sustain defined: investments the primary purpose of which is to replace or refurbish existing assets in order to maintain performance and capabilities “Core sustain” investment is prioritized through condition-based risk assessments, in which the highest priority is assigned to the most critical equipment and facilities at greatest risk of failure, obsolescence, safety issue, or other risk factor. Included are upgrades necessary to make core sustain investment viable, such as access roads that enable line replacements. Prioritization fo core sustain investment occurs within the asset strategies that are developed by each asset category and approved by the CAB. “Core” sustain investment will be specified for each asset strategy at the time the CAB approves the strategy. Sustain investment that is not prioritized and approved through asset strategies will be treated as “discretionary”. Examples include OMET, Synchrophasors, most new IT applications, Keys Decoupling, and new or expanded maintenance headquarters. -- -- -- -- -- Energy Efficiency capital spending that implements the Council’s current power plan and Fish and Wildlife capital investments that implement the BIOp and current fish accords are generally prioritized by entities outside the FCRPS. For purposes of this process, these investments will be treated as if they were “core sustain” investments, i.e., they will not be subject to the economic analysis and priority ranking process described below for Expansion and “Non-Core” Sustain investment. The treatment of energy efficiency investment associated with future power plans and fish and wildlife investments associated with new fish accords will be determined later, as part of Phase 2.
How are the categories defined? How will the projects in each category be treated? Expansion and Remaining Sustain Investment Investment that “grows” the asset base, i.e., adds capacity or new capabilities, or that increases operational output or productivity. Also includes sustain investment that is “non-core” 7
A 3-year prioritization window • A “prioritization window” is the time horizon for which investments will be pooled and optimized • The window is a rolling window • The window right-shifts in 6-month increments as the portfolio is refreshed on a 6-month cycle • A 3-year horizon with fits with the IPR process
Overview of the process Determine financing strategy for portfolio Define and submit new projects Validate list of new projects Evaluate new projects (Base case) Evaluate new projects (Probabilistic) Gather & assess the information for newly submitted projects Re-Balance the portfolio Prepare portfolio decision materials for CAB Implement the balancing decisions Finalize and review business cases Authorize and fund projects Monitor project performance Peer reviews (Input) Project results and interdependency reviews Peer review categorization new projects Update information of existing projects Update evaluation of existing projects Existing process (simplified) A systematic agency-level process will replace decentralized processes Yellow boxes: steps requiring executive action Orange boxes: steps involving peer reviews The new agency-level process is designed to create a level playing field across asset categories, enhance transparency, improve analytical rigor, and build an integrated, holistic approach to developing and selecting investments The process will encompass Policy Commitment and Discretionary projects that are newly conceived, projects introduced previously but not yet authorized, and projects authorized and underway. New projects will be proposed and existing project proposals will be refreshed on a 6-month cycle Checks and balances have been designed into the process to ensure consistency and safeguard against gaming (e.g., peer reviews)
Projects will be evaluated using three “tests” • Strategic fit • An advisory assessment of each project’s usefulness in delivering on the agency’s strategic priorities • This test applied to Discretionary projects only; the test is assumed to be met for Compliance and Policy Commitment projects • Value contribution • Project benefits and costs are evaluated using two principal metrics: • “Net Economic Benefits Ratio” (applies to Policy commitment and to Discretionary projects, but not Compliance projects) • “NPV BPA Cash Flows” (applies to all three types of projects) • Policy Commitment and Discretionary projects will be ranked initially on the basis of the first metric, Net Economic Benefits Ratio • Feasibility • Evaluates the affordability, revenue requirement impact, and execution risks of project portfolios
What are the ingredients of the Net Economic Benefits Ratio? PV Economic Benefits – PV Project Investment Net Economic Benefit Ratio = PV Project Investment “Bang for the buck” ratio SMEs/project submitters will be asked to submit a quantitative range for each key cost and benefit input (e.g., p10, p50, p90) “PV Project Investment” includes the present value of: Upfront project costs (project planning, environmental review (NEPA), land/land rights acquisition, procurement, construction/installation) “PV Economic Benefits” includes the present value of (examples): Avoided congestion costs (avoided fuel and other production costs that are enabled by adding capacity on constrained transmission paths) Avoided power purchase costs or increased power sales Labor cost savings through process efficiencies Avoided customer value losses from outages Avoided CO2 or other environmental costs (monetized) Post project maintenance and operations costs (maintenance, repairs, monitoring, licensing (IT), support)
The test for economic valueEach project will be evaluated through standardized lenses 100% PV of project net benefit and key risk factors (Illustrative) Time series of cost, benefit and resource requirement (Illustrative) 80% 60% 40% 20% Uncertainties in project value will be captured probabilistically Base case 0% Cumulative probability $ cost, Benefit, FTEs Economic benefit of the project ($) Market price Load growth Sensitivity analyses will identify key value/risk drivers Wind gen. scenario Steel price Land acquisition cost years Design cost … … Value/net benefit will be quantified from two perspectives: • Value to BPA and its stakeholders • Value to Region 12
Once projects have been evaluated, the results will be compiled and examined from a portfolio perspective • Portfolio starting point: projects are ranked purely on the basis of their net economic benefit ratios • The CAB may then make changes to the portfolio -- defer, accelerate, remove or add projects – by taking into account such factors as: • The portfolio’s effectiveness in delivering the agency’s strategic priorities • Project interdependencies (e.g., overlaps and gaps, sequencing) • Cost and benefit uncertainties/risks • The availability of labor resources and planned outage time needed to execute the portfolio as proposed • The availability of capital for projects covered by the portfolio • The beneficiaries of projects and whether costs are allocated roughly commensurate with benefits received • The portfolio’s impact on power and transmission revenue requirements and rates • Expectations for portfolio performance • The net impact of any changes on economic value • The CAB will be provided with a variety of decision support materials, such as shown on the following slides
Economic Value Test(Net Economic Benefits Ratio) Economic Test Project (Expected Present Value) Project Investment Detail (Nominal Dollar, p50 Case) Economic Project Benefits – Investment Asset Project (excl. Sunk Net Economic 2013-2015 Status Category Category Investment Cost) Benefits Ratio 2013 2014 2015 2016 2017 2018 Total Budget Name 1 Project C A-I D 3 2,346.00 68.61 33.85 30.0 30.0 12.0 6.0 0.0 0.0 78.0 72.0 2 Project E A-I D 4 318.60 12.78 26.79 2.0 2.0 4.0 4.0 4.0 0.0 16.0 8.0 3 Project A N PC 6 3,495.00 145.23 21.83 0.0 70.0 40.0 40.0 20.0 10.0 180.0 110.0 4 Project B A-I D 5 549.00 30.93 16.16 10.0 10.0 12.0 4.0 0.0 0.0 36.0 32.0 5 Project D A-NI D 3 954.00 72.33 12.78 30.0 36.0 12.0 4.0 0.0 0.0 82.0 78.0 6 Project I D 7 474.00 41.09 11.69 2.0 8.0 20.0 10.0 6.0 6.0 52.0 30.0 7 Project G N PC 4 849.60 79.72 10.01 0.0 20.0 36.0 30.0 14.0 0.0 100.0 56.0 8 Project AG N D 7 74.88 9.41 8.13 0.0 4.0 2.0 2.0 2.0 2.0 12.0 6.0 9 Project F N D 5 216.72 29.87 6.48 0.0 16.0 12.0 8.0 0.0 0.0 36.0 28.0 10 Project N A-I PC 7 66.96 10.22 6.62 10.0 1.0 0.0 0.0 0.0 0.0 11.0 11.0 11 Project AU N D 1 128.16 24.67 4.96 10.0 4.0 4.0 4.0 4.0 4.0 30.0 18.0 12 Project Q A-NI D 7 370.80 85.43 4.48 20.0 40.0 24.0 16.0 0.0 0.0 100.0 84.0 13 Project H N PC 3 662.40 151.58 4.12 0.0 24.0 76.0 50.0 24.0 20.0 194.0 100.0 14 Project J A-I PC 4 215.28 59.08 3.44 20.0 20.0 10.0 10.0 10.0 0.0 70.0 50.0 15 Project K A-NI D 6 93.60 35.02 2.75 4.0 12.0 18.0 8.0 0.0 0.0 42.0 34.0 16 Project AN D 3 122.40 43.88 2.75 20.0 16.0 10.0 4.0 0.0 0.0 50.0 46.0 17 Project AF D 4 288.00 118.90 2.49 48.0 48.0 30.0 10.0 0.0 0.0 136.0 126.0 18 Project O N PC 7 326.04 159.35 1.95 0.0 50.0 60.0 60.0 20.0 10.0 200.0 110.0 19 Project P D 6 17.16 8.98 1.86 4.0 6.0 0.0 0.0 0.0 0.0 10.0 10.0 20 Project R D 3 80.52 43.67 1.82 0.0 50.0 0.0 0.0 0.0 0.0 50.0 50.0 Illustrative Status: “A-I” – Authorized and Initiated, “A-NI” – Authorized, but Not Initiated, “N” – Newly added, Blank – Previously added, not authorized Category: “D” – Discretionary Project, “PC” – Policy Commitment Project
Funding Curve (Overall) Illustrative Discretionary & Policy Commitment Projects 3-year capital spending forecast (illustrative) A funding curve can be used to both to establish a capital budget and optimize a budget’s implementation as conditions change Projects to the left of this line have a 3:1 net economic benefits ratio Projects to the right of this line have less than a 1:1 ratio Compliance Projects Core Sustain Projects Cumulative FY 2013-2015 Capital Expenditures (Nominal $, M) 15 15 Balancing/re-balancing the portfolio
Priority ranking is compared to available capital budgetIllustration Previous 3-year capital spending forecast • Different colors represent projects in different asset categories • Different shapes represent project status • Square = “In flight” projects • Diamond = Projects previously nominated -- updated • Triangle = newly nominated projects • Red Label = Policy Commitment projects • This is the first portfolio alternative that the CAB would review – the one constructed based purely on economic value • Alternative 1 “Maximize Economic Value within budget constraint” • Projects selected: C, E, A, B, D, I, G, AG, F, N, AU, Q, H, J, K, AN, AF (16 Projects) • Total Economic Value (Expected Value, PV): $ 11.2B • Total Investment (PV): $1,02B • Overall economic value ratio: 11.0 , Marginal ratio : 2.49 (Project AF) • 2013-2015 Budget Needs: $889M 16
Project value and project cost uncertainties will be considered (Illustration: Portfolio Alternative 1) Legend 10% 50% 90% Expected Value Economic benefit uncertainties Investment cost uncertainties Typically, project benefit uncertainties are greater than project cost uncertainties
Comparing Portfolio AlternativesIllustration Portfolio alternatives may be designed to reduce risk/uncertainty, smooth out costs and benefits over time, redistribute costs and benefits across asset categories, or meet other objectives Each alternative will be evaluated for economic, access to capital, revenue requirement/rate, and other implications Alternative 1 Alternative 2 Alternative 3 Alternative1: Maximize economic value Alternative 2: All Policy Commitment projects funded ahead of discretionary projects Alternative 3: Reduce uncertainty .
Feasibility test Portfolio alternatives will be reviewed for their feasibility before a selection is made • Is the portfolio of investments affordable(Is the needed capital available? Will O&M funding be available to sustain the asset after it is placed in service?) • Are the implications for BPA cash flows acceptable (net present value of cash flows)? • Are the implications for BPA revenue requirements acceptable (present value of revenue requirements)? • Who are the beneficiaries of economic value? Can the project costs be allocated/shared equitably? • Are resource and outage requirements manageable?
Key changes to proposed methodology In response to stakeholder comments receivedduring the Capital Investment Review
Next steps • BPA will proceed with Phase 2 of its agency-wide prioritization process – Test/Prove and Prepare for Implementation • We will provide stakeholders with an update on our progress at the February, 2013 QBR