Download
1 / 28
280 likes | 400 Views
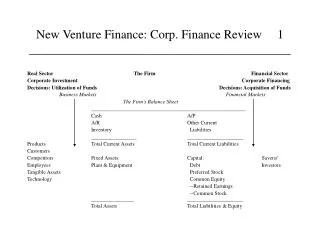
THE VENTURE FINANCE ECOSYSTEM. Michael Danaher Wilson Sonsini Goodrich & Rosati October 2004. So Goes Nasdaq... The New Economies Continue What’s with Valuations? What’s with IPO’s? The LP Glut The Coming Crisis. So Goes Nasdaq. The Venture Ecosystem Food Chain. Nasdaq. LPs. GPs.

E N D
THE VENTURE FINANCE ECOSYSTEM Michael Danaher Wilson Sonsini Goodrich & Rosati October 2004
So Goes Nasdaq... • The New Economies Continue • What’s with Valuations? • What’s with IPO’s? • The LP Glut • The Coming Crisis
The Venture Ecosystem Food Chain Nasdaq LPs GPs Portfolio Companies OPEX CAPX
$81.2 $80 $60 $55.5 $49.3 Funds Raised ($B) $40 $25.7 $14.2* $20 $15.9 $12.9 $12.1 $8.7 $7.1 $7.3 $6.7 $5.7 $0 1993 1994 1995 1996 1997 1998 1999 2000 2001 2002 2003 1H04 Source: “Venture Capital Industry Overview,” VentureOne, October 2004 So Goes Nasdaq... FUND INFLOWS Source: Bloomberg, Nasdaq 1992-2004 * Annual projection
6262 $100 6,000 $94.5 5,000 4563 $75 4,000 3221 $49.4 Amount Invested ($B) $50 Number of Deals 3,000 2543 2307 2211 $36.1 2024 2002* 1912 2,000 1315 $20.8* $21.6 $25 1075 $18.4 959 $17.9 1001 $13.1 1,000 $10.4 $9.2 $6.4 $4.4 $3.6 $0 0 1993 1994 1995 1996 1997 1998 1999 2000 2001 2002 2003 1H04 Number of Deals Amount Invested ($B) So Goes Nasdaq... FUND OUTFLOWS Source: “Venture Capital Industry Overview,” VentureOne, October 2004 Source: Bloomberg, Nasdaq 1992-2004 * Annual projection
So Goes Nasdaq... LIQUIDITY EVENTS Aggregate Value ($B) Aggregate # of M&A/IPO Source: “Venture Capital Industry Overview,” VentureOne, October 2004 YTD04 = 1Q04 – 3Q04 Source: Bloomberg, Nasdaq 1992-2004 * YTD04: 1Q04-3Q04
New Economies ContinueRun Silent, Run Cheap • Continued frugality in the portfolio companies • Continued productivity gains - more with less • Outsourcing to India and China became a torrent • WSGR setting up 1 Indian sub a week
$14 $14.4 $12 $10.0 $10 $10.0 $9.0 $8.0 $8 Median Amount Invested ($M) $6 $5.1 $5.0 $4 $1.5 $2 $1.0 $0 2Q01 3Q01 4Q01 1Q02 2Q02 3Q02 4Q02 1Q03 2Q03 3Q03 4Q03 1Q04 2Q04 Later Round Second Round First Round Seed Round Deal Size Remains Constant Source: “Venture Capital Industry Overview,” VentureOne, October 2004
$25.5 $25 $21.5 $20 $16.0 $15.5 $15 $13.6 Median Pre-money Valuation ($M) $12.9 $11.1 $10.5 $10.0 $10.0 $9.3 $10 $8.2 $5 $0 1993 1994 1995 1996 1997 1998 1999 2000 2001 2002 2003 1H04 Median Pre-money Valuation by Year Source: “Venture Capital Industry Overview,” VentureOne, October 2004
$50 $45 $40 $30 Median Pre-money Valuation ($M) $25 $20 $18 $15 $8 $10 $5 $3 $3 $0 2Q01 3Q01 4Q01 1Q02 2Q02 3Q02 4Q02 1Q03 2Q03 3Q03 4Q03 1Q04 2Q04 Later Rounds Second Round First Round Seed Round Median Pre-money Valuations by Round Source: “Venture Capital Industry Overview,” VentureOne, October 2004
The View From the Ground • More deal competition, more bidding wars • More up-rounds • More eyebrow-raising rounds
WSGR Venture Financing * Top 5 avaerage, top 2 values
250 $30 250 216 202 $25 200 $19.5 $19.2 $20 144 150 Amount Raised ($B) Venture-Backed IPOs 120 115 $15 100 68 $10 $8.7 48 $5.0 50 $4.6 $5 $3.7 22 22 $3.8 20 $2.8 $1.8 $1.4 $1.6 $0 0 1994 1995 1996 1997 1998 1999 2000 2001 2002 2003 YTD04* Amount Raised ($B) Venture-Backed IPOs Number of IPO’s Source: “Venture Capital Industry Overview,” VentureOne, October 2004 *YTD04: 1Q04-3Q04
YTD04* 2003 2002 2001 2000 1999 1998 1997 1996 1995 0% 20% 40% 60% 80% 100% IPOs M&As IPO’s vs. M&A Source: “Venture Capital Industry Overview,” VentureOne, October 2004 *YTD04: 1Q04-3Q04
Why the Decline? • Public market profitability requirements • Perceived volatility vs. M&A security • Sarbanes burden • Decreased research coverage
Earnings Matter More The WSGR IPO Universe
The LP Glut • Portfolio companies are staying frugal • GP’s are staying frugal—fund sizes remain down But • LP’s • Increasing fund investments in proportion to public market • Increasing percentage allocation to VC asset class = Global Warming in the Venture Ecosystem?
The LP Glut “Why Venture Funds Don’t Want Your Cash” -N.Y. Times “Too Much Money Chasing Too Few Good Funds” -Venture Capital Journal
The LP Glut The Fishing Fleet Example • Fleet profitability • Gill nets and trollers • New fishing grounds
New Fishing Grounds • China and India • Domestic • Energy/Clean tech
Crisis in the Making? • Global technology competition is increasing rapidly • Funding • Talent • Activity • Historically, the U.S. competes by attracting the best and brightest from around the world
Crisis in the Making? The Department of Homeland Sabotage • Foreign applications to graduate school down one-third! • Visa process discouraging visits by foreign students and businessmen • Work visa limitations reducing high tech talent


![Venture Capital and the Finance of Innovation [Course number]](https://cdn2.slideserve.com/4651090/venture-capital-and-the-finance-of-innovation-course-number-dt.jpg)