Download
1 / 14
140 likes | 285 Views
Earth, Science, & Maps Caleb Nicholson January 6, 2010 CEC - WD2. Table of Contents. Continents Oceans Latitude & Longitude Climate Zones Global Wind Patterns Ocean Surface Currents. Asia. North America. Continents. Europe. Africa. Antarctica. South America. Australia. Oceans.

E N D
Earth, Science, & Maps Caleb Nicholson January 6, 2010 CEC - WD2
Table of Contents • Continents • Oceans • Latitude & Longitude • Climate Zones • Global Wind Patterns • Ocean Surface Currents
Asia North America Continents Europe Africa Antarctica South America Australia
Oceans Antarctic Pacific Atlantic Southern Indian
Latitude & Longitude B X Atlantic C H J X Indian CT
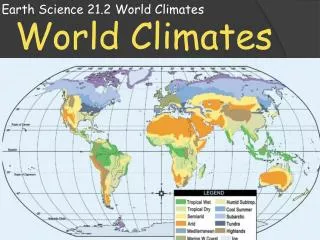
Climate Zones Polar Zone: 66.5°N – 90°N Temperate Zone: 23.5°N - 66.5°N Tropic Zone: 23.5°N – 23.5°S Temperate Zone: 23.5°S - 66.5°S Polar Zone: 66.5°S – 90°S
Global Winds Polar Cells Rising Air Polar Easterlies 60°N Ferrel cell Sinking Air Westerlies 30°N 0° Trade Winds Rising Air Hadley cells Westerlies 30°S 60°S Polar Easterlies Polar Easterlies
Nike Shoe Investigation-Ocean Surface Patterns 1. 4. 7. 3. 2. 3. 5. 6. 8. 9. 10.
Nike Shoe Investigation cont. E W 4. 1. 7 3. Oyashio 10. 3. Alaska 5. 2. 6. 9. N. Pacific 8.
Analysis of Data 1- Define these terms: (a) gyre (b) current (c) eddy 2- By looking at the data you plotted on your map, write a sentence or two describing the general shape of the route or pathway taken by the drifting shoes. 3- Write a few sentences EXPLAINING this pathway using appropriate terms from #1 above. 4- Using an atlas or other reference showing the major surface currents in the Pacific Ocean, (a) List the names for each of the currents that affected the distribution of the shoes, and (b) write them on your map showing their correct location
Analysis of Data Answers 1. (a) gyre – Coil (b) current – steady flow of fluid (e) eddy – flow in a circular current 2. The shoes flowed in a somewhat circular motion. 3. The current that the shoes were in was flowing in a it was an eddy current. 3. (a) North Pacific, Oyashio, and Alaska are the currents that affected the shoe distribution. (b)
Latitude & Longitude 1. Draw a red line along the equator (0 degrees latitude). 2. Draw a purple line along the Prime Meridian (0 degrees longitude). 3. In which ocean is the location 10 degrees S latitude, 75 degrees E longitude located? Mark it on the map with a blue "X" and write the name of the ocean. 4. In which ocean is the location 30 degrees N latitude, 60 degrees W longitude located? Mark it on the map with a blue "Y" and write the name of the ocean.
Latitude & Longitude Cont. MU. Mumbai: 19°N, 72°ENA. Nairobi: 1°S, 37°ENO. New Orleans: 30°N, 90°WNY. New York: 40°N, 74°WR, Rio de Janeiro: 23°S, 43°WSE. Seattle: 47°N, 122°WSY. Sydney: 34°S, 151°ETK. Tokyo: 35°N, 139°ET. Toronto: 43°N, 79°WT. Toronto: 43°N, 79°W 5. Mark the following cities on the map in red: B. Beijing: 40°N, 116°EC. Cairo: 30°N, 31°ECT. Cape Town: 34°S, 18°EH. Hong Kong: 22°N, 114°EJ. Jakarta: 6°S, 106°ELA. Los Angeles: 34°N, 118°WLI. Lima: 12°S, 77°WLO. London: 51°N, 0°WMC. Mexico City: 19°N, 99°W MO. Moscow: 55°N, 37°E