Download
1 / 1
10 likes | 127 Views
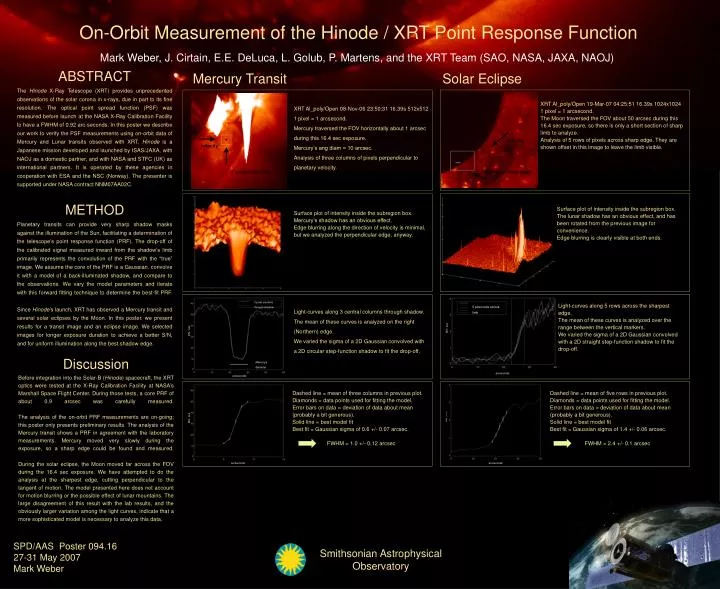
Mark Weber, J. Cirtain, E.E. DeLuca, L. Golub, P. Martens, and the XRT Team (SAO, NASA, JAXA, NAOJ).

E N D
Mark Weber, J. Cirtain, E.E. DeLuca, L. Golub, P. Martens, and the XRT Team (SAO, NASA, JAXA, NAOJ) ABSTRACTThe Hinode X-Ray Telescope (XRT) provides unprecedented observations of the solar corona in x-rays, due in part to its fine resolution. The optical point spread function (PSF) was measured before launch at the NASA X-Ray Calibration Facility to have a FWHM of 0.92 arc-seconds. In this poster we describe our work to verify the PSF measurements using on-orbit data of Mercury and Lunar transits observed with XRT. Hinode is a Japanese mission developed and launched by ISAS/JAXA, with NAOJ as a domestic partner, and with NASA and STFC (UK) as international partners. It is operated by these agencies in cooperation with ESA and the NSC (Norway). The presenter is supported under NASA contract NNM07AA02C. Mercury Transit Solar Eclipse On-Orbit Measurement of the Hinode / XRT Point Response Function XRT Al_poly/Open 19-Mar-07 04:25:51 16.39s 1024x10241 pixel = 1 arcsecond.The Moon traversed the FOV about 50 arcsec during this 16.4 sec exposure, so there is only a short section of sharp limb to analyze.Analysis of 5 rows of pixels across sharp edge. They are shown offset in this image to leave the limb visible. XRT Al_poly/Open 08-Nov-06 23:50:31 16.39s 512x5121 pixel = 1 arcsecond.Mercury traversed the FOV horizontally about 1 arcsec during this 16.4 sec exposure. Mercury’s ang diam = 10 arcsec.Analysis of three columns of pixels perpendicular to planetary velocity. velocity velocity 3 central columns 5 rows at sharp edge METHODPlanetary transits can provide very sharp shadow masks against the illumination of the Sun, facilitating a determination of the telescope’s point response function (PRF). The drop-off of the calibrated signal measured inward from the shadow’s limb primarily represents the convolution of the PRF with the “true” image. We assume the core of the PRF is a Gaussian, convolve it with a model of a back-illuminated shadow, and compare to the observations. We vary the model parameters and iterate with this forward fitting technique to determine the best-fit PRF. Since Hinode’s launch, XRT has observed a Mercury transit and several solar eclipses by the Moon. In this poster, we present results for a transit image and an eclipse image. We selected images for longer exposure duration to achieve a better S/N, and for uniform illumination along the best shadow edge. Surface plot of intensity inside the subregion box.The lunar shadow has an obvious effect, and has been rotated from the previous image for convenience.Edge blurring is clearly visible at both ends. Surface plot of intensity inside the subregion box.Mercury’s shadow has an obvious effect.Edge blurring along the direction of velocity is minimal, but we analyzed the perpendicular edge, anyway. 3 pixel columns through shadow Light-curves along 5 rows across the sharpest edge.The mean of these curves is analyzed over the range between the vertical markers.We varied the sigma of a 2D Gaussian convolved with a 2D straight step-function shadow to fit the drop-off. 5 pixel rows across limb Light-curves along 3 central columns through shadow.The mean of these curves is analyzed on the right (Northern) edge. We varied the sigma of a 2D Gaussian convolved with a 2D circular step-function shadow to fit the drop-off. DN / sec DN / sec DiscussionBefore integration into the Solar-B (Hinode) spacecraft, the XRT optics were tested at the X-Ray Calibration Facility at NASA’s Marshall Space Flight Center. During those tests, a core PRF of about 0.9 arcsec was carefully measured.The analysis of the on-orbit PRF measurements are on-going; this poster only presents preliminary results. The analysis of the Mercury transit shows a PRF in agreement with the laboratory measurements. Mercury moved very slowly during the exposure, so a sharp edge could be found and measured. During the solar eclipse, the Moon moved far across the FOV during the 16.4 sec exposure. We have attempted to do the analysis at the sharpest edge, cutting perpendicular to the tangent of motion. The model presented here does not account for motion blurring or the possible effect of lunar mountains. The large disagreement of this result with the lab results, and the obviously larger variation among the light curves, indicate that a more sophisticated model is necessary to analyze this data. Mercury’s diameter arcseconds arcseconds Dashed line = mean of three columns in previous plot.Diamonds = data points used for fitting the model.Error bars on data = deviation of data about mean (probably a bit generous).Solid line = best model fitBest fit = Gaussian sigma of 0.6 +/- 0.07 arcsec. FWHM = 1.0 +/- 0.12 arcsec Dashed line = mean of five rows in previous plot.Diamonds = data points used for fitting the model.Error bars on data = deviation of data about mean (probably a bit generous).Solid line = best model fitBest fit = Gaussian sigma of 1.4 +/- 0.06 arcsec. FWHM = 2.4 +/- 0.1 arcsec DN / sec DN / sec arcseconds arcseconds Smithsonian Astrophysical Observatory