Download
1 / 27
270 likes | 273 Views
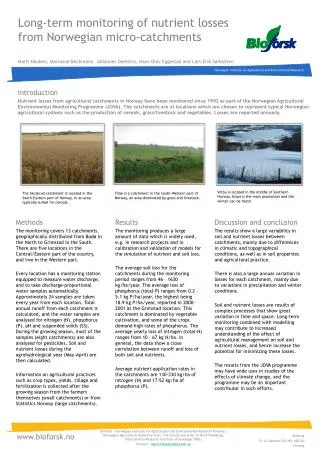
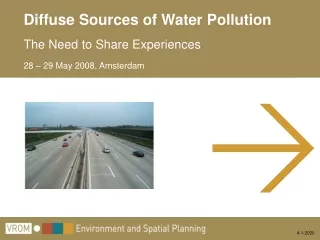
http://www.euroharp.org. Towards European Harmonised Procedures for Quantification of Nutrient Losses from Diffuse Sources January 2002 – December 2005 Update to EEA expert meeting, Copenhagen, February 2005. Brian Kronvang NERI, Denmark. Retention in groundwater !. DELAYS/LAGS !.

E N D
http://www.euroharp.org Towards European Harmonised Procedures for Quantification of Nutrient Losses from Diffuse Sources January 2002 – December 2005 Update to EEA expert meeting, Copenhagen, February 2005 Brian Kronvang NERI, Denmark
Estimated total P-loss from agricultural areas via pathways to Danish surface waters P - many pathways and retention! Total P (tonnes/year) Erosional pathways 290 - 740 • Water erosion 10 - 80 • Bank erosion 275 - 645 • Wind erosion 5 - 15 Leaching and tile drainage water 65 - 405 • Loss via tile drains from normal fields 20 - 90 • Loss via tile drains from risk areas 15 - 90 • Loss via tile drains in organic soils 30 - 225 Leaching and groundwater 125 - 210 • Leaching and upper groundwater 80 • Deeper groundwater 45 - 130 Atmospheric deposition (++++) < 5 Total 485 - 1360
Application and evaluation of nutrient loss quantification tools - Strengths and weaknesses • Potential suitability / capability • Boundaries • Performance
EUROHARP tasks/deliverables (i) A priori review of nutrient quantification tools (2002-3) EUROHARP Report No. 1 (www.euroharp.org). (ii) Development of performance assessment tests (2002-3). EUROHARP Report No. 8 (www.euroharp.org). (iii) Model application on three core catchments (2003-4). (iv) Development of EUROHARP nutrient retention Handbook and Tool (NUTRET) (2002-4). EUROHARP Report No. 10 (In print). (v) Estimates of trends, retention and SA (2002-4) EUROHARP Reports and Posters. • Applicability tests on additional catchments (2004-5) • Scenario assessments, synthesis and conclusions (2005) • Development of end-user toolbox (2005)
Data oriented (empirical) Annual predictions based on export coefficient approach Low SA,NOPOLU Level of complexity Methods differ profoundly in their complexity, level of process representation and data requirements Model type Process oriented (deterministic) High Daily simulations of flow and solute concentrations NL-CAT SWAT Different model approaches
Source Apportionment: A = L - P - S - B + R - D A = Diffuse losses from Agricultural Areas L = Total measured losses P = Losses from Point Sources S = Losses from Scattered dwellings B = Losses from Background/natural areas R = Retention in lakes and rivers D = Atmospheric Deposition on Freshwater
6.2 88 36.5 48 1.0 1.2 1. 2 1. 0
Guadiamar, Spain Missing data for SA • Only DRP and NO3 - monthly average. • No recent monitoring data. • Bad discharge data. • No point source information. • No background data. • No atmospheric deposition.
OUTLET Blind/without retention blind / without retention fitted
Most modelling procedures GIS database QT • NOPOLU • SWAT • NL-CAT • MONERIS • N-LES • TRK
Odense-catchment daily concentrations at outlet (station 102235)
Yearly measured and simulated losses of N and P at outlet - River Odense Catchment, DK Modelled with NL-CAT
Modelled leaching and loss of nitrogen from agricultural land in two EUROHARP catchments
Annual N-loss (kg N/ha) from agricultural land with different retention estimates (incl SA= Load - Point sources + Retention - Background) Ouse Vansjø Enza Retention Minimum 31.0 (EvenFlow) 22.2 (EvenFlow) 10.0 (SWAT) Maximum 44.2 (NL-CAT) 91.9 (SA) 13.6 (TRK) Median 37.0 43.7 12.5
0.5 16.8
Annual P-loss (kg P/ha) from agricultural land with different retention estimates applying SA Ouse Vansjø Enza Retention Minimum 0.78 (SA) 0.40 (SWAT) 1.37 (MONERIS) Maximum 1.38 (MONERIS) 2.75 (NL_CAT) 1.37 (SA) Median 0.90 2.29 1.37
EUROHARP – 2005 workplan toolbox development for end users • specification for scenario testing now agreed (2005 task) • Results being analysed during 2005 …. • feedback into HARP-NUT revision (Guidelines 6 & 9) • Final workshop due in spring 2006 Thank you for your attention http://www.euroharp.org