Download
1 / 36
360 likes | 458 Views
NUTRIENT LOSSES FROM MANAGEMENT INTENSIVE GRAZING DAIRY FARMS IN CENTRAL MARYLAND. Ray R. Weil and Rachel E. Gilker Dept. of Natural Resource Sciences and Landscape Architecture University of Maryland, College Park in collaboration with Bill Stout late, USDA Pasture Lab, PA. …into Milk.

E N D
NUTRIENT LOSSES FROM MANAGEMENT INTENSIVE GRAZING DAIRY FARMS IN CENTRAL MARYLAND Ray R. Weil and Rachel E. Gilker Dept. of Natural Resource Sciences and Landscape ArchitectureUniversity of Maryland, College Park in collaboration with Bill Stout late, USDA Pasture Lab, PA
…into Milk Dairy Farming: Changing Feed… Feeding silage Grazing
Confined Feeding Systems Manure on the move • Grow, harvest and transport crops. • Import feed and fertilizer • Collect, store and haul manure High capital costs • High production per cow and per acre. • High cost per CWT milk. Cows standing still
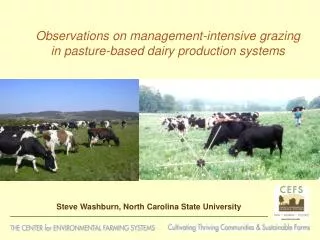
Management Intensive Grazing (MIG) • Farmland covered in perennial grass instead of annual crops. Little erosion or sediment loss • Cows managed to ‘harvest’ feed and ‘spread’ manure. • Low need for imported feed, fertilizer, fuel. Grass stands still • Seasonal milk production • Modest production per cow • Much lower cost per CWT Higher profitability. • Less control over manure/urine distribution? Cows harvest feed
Grazers control manure distribution by managing cows, water, fencing, etc.
Grass controls erosion…but does grazing cause nutrient pollution? • 70 -85% of N and P ingested passes thru the cow. • 500-1000 kg N/ha/yr directly under urine and fecal patches. • Excretions by grazing cows cover only about 15% of pasture surface in any 1 year.
Nutrient Pollution Research • Previous research has suggested intensive grazing causes high N leaching. • NZ and European research used high N fertilization rates (300 - 600 kgN/ha). • Monolith lysimeters used in some research may cause artifact ponding and preferential flow patterns.
N fertilizer White clover Nutrient Pollution Predictions Stocking rates on MIG farms in our study Predicted Mean Annual Ground Water Nitrate-N (ppm) Cumulative Seasonal Stocking Rates (AUD/ha) From: Stout, W.L., et al. 2000. J. Soil Water Cons.:238-243.
Artifact ponding and preferential flow? Urine spots in the field Relative size of leaching lysimeter
Objectives were to… • monitor nutrient concentrations in groundwater under 4 MIG and 2 confined-feeding watersheds. • estimate nutrient loading from 1 confined feeding and 2 MIG dairy farms. • calculate whole farm nutrient balances for the 3 farms. • determine if organic forms constitute significantpart of N and P leaching losses.
Recent studies suggest organic forms may be important for N and P losses… • Currie et al, 1996: Measured DON at 56 & 67% of total N under pine and hardwood stands. (MA) • Smolander et al, 2001: DON was 62-83% of total N in soil solution under spruce stands. (Norway) • Streeter et al, 2003: 60% of the N in lakes of agricultural catchments in organic form (UK) • Willet et al, 2004: DON makes up 40-50% of total N in streams and lakes, and may be >85% of TDN. (Wales)
Hypotheses • Average groundwater N and P under MIG will be ≤those under confined feeding. • Annual average N and P will be below acceptable limits. Nitrate-N: 10 mg/L Dissolved Reactive Phosphate: 0.01 mg/L? Total P: 0.1 mg/L? • Nutrient surpluses lower on the MIG farms than on the confined feeding farm. • Significant organic N and P in groundwater under dairy farms.
Grazer1 Grazer2 Confined Farm, ha 83 71 245 AU1/ha 0.95 2.2 2.1 Vegetation pasture/ 8% legume pasture/ 24% legume 6 yr: corn/oats/ alfalfa AUD2 or Manure 348 810 23 t ha-1 y-1 Surplus kg/ha N 54 71 173 P 1.5 7.8 9.9 Three Md. Farms in this Study Profit: $/CWT: 6.994.343.60 1 AU = one animal unit of 454 kg 2 AUD = annual AU days per ha
Methods… • 3 farms, each with 2 watersheds (A and B). • A transect of 3 piezometer nests at outlet of each watershed (+ 1 upslope control well on each farm). • 3 or 4 piezometers in each nest – each 1 m deeper than the next. • 5 stations 100 m apart along each of two streams on Grazer 2 farm. A nest of three piezometers
1- 6 ha watershed C B A Groundwater Monitoring Design Nest C Nest B Nest A
Sampling May 2001-July 2004 Confined A • Groundwater sampled biweekly. • Streams on Grazer 2 farm sampled biweekly + plus storms. Grazer 2 A
Nitrate - Nand groundwater levels under six watersheds 05/01 – 06/04 Water table Nitrate-N Because of drought, only data from 10/02 – 06/04 used for statistical comparisons
Nitrate-N in groundwater under six watersheds during the study period 2003 2004 2002 N=2700 Distance weighted least squares lines Drought period (5/01-11/02) excluded
95% confidence Interval for mean Box plot Annual average nitrate –N
Nest c Nest b Nest a Nitrate-N in three piezometer nests under six watersheds during the study period Jan 02 – Mar 04
Groundwater nutrients by proximity of watershed to barnyard Nitrate-N Dissolved Organic P
Dissolved Organic and Inorganic Nitrogen in Groundwater under Six Dairy Watersheds DON = 20% of Total N
Dissolved Organic and Inorganic Phosphorus in Groundwater under Six Dairy Watersheds Grazer 2 farm located on calcareous parent material. Means of 106 to 160 samples Org. P varies from 20 to 43% of Total dissolved P
Storm Flow Base Flow Stream Flow Stream Flow Stream Water Total Nitrogen Watershed A
Storm Flow Base Flow Stream Flow Stream Flow Stream Water Total Nitrogen Watershed B
Streamwater P across grazed watersheds (means of two streams) Storm flow Base flow Flow direction Flow direction
Stream Flow Stream Flow TDP TDN
a Vinten, A.J.A. 1999. Predicting water and chloride transport in drained soils derived from glacial till. J. Environmental Quality 28:980-987.
Relationship Between Nutrient Input-output Surplus and Estimated Nitrate-N Leaching Loss for Three Maryland Dairy Farms.
Summary for MIG watersheds • Annual stocking rates were 348-810 animal days/ha. • Monolith lysimeter research (Stout et al., 2000) predicted annual average NO3-N of 15 and 32 ppm in leachate for these stocking rates. • We found annual average NO3-N of 4 and 6 ppm in shallow groundwater for these stocking rates.
Summary for MIG groundwater • Nitrate-N averaged 4.4 mg/L. • Total dissolved N averaged 5.2 mg/L. (of which 20 ± 2% was organic) • Total dissolved P averaged 0.136 mg/L. (of which 32 ± 1 % was organic)
Summary for MIG watersheds • Stream base-flow N and P levels not affected by grazed pastures. • Storm flow P in one stream was elevated when passing winter holding area. • Nutrient surpluses/ha on grazing farms were lower than on confined farm, even if animal units/acre were equal.
Conclusions • We found N and P leaching under MIG pastures no higher than under manured cropland. • N leaching losses were related to surplus in farm nutrient balance. • MIG appears to have potential as a profitable Best Management Practice for environmental quality.
Thanks to the NE SARE program of USDA for funding, and to the three farmers for their kind cooperation and good stewardship of the land.