Download
1 / 56
640 likes | 910 Views
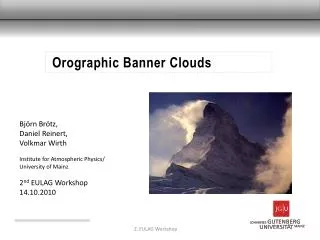
Orographic Precipitation . John Horel Department of Meteorology University of Utah john.horel@utah.edu Acknowledgments Jim Steenburgh , U/Utah. Steenburgh and Alcott 2008. Steenburgh and Alcott (2008). Alta, UT. April 12, 2005 173 inches 440 cm. Photo: D. Whiteman.

E N D
Orographic Precipitation John Horel Department of Meteorology University of Utah john.horel@utah.edu Acknowledgments Jim Steenburgh, U/Utah Steenburgh and Alcott 2008
Alta, UT April 12, 2005173 inches 440 cm Photo: D. Whiteman
Salt Lake City Snow Season Mean: 161 days from first 1inch to last Duration (days) of Season Relative to Mean Year
References • Bailey, C. et al., 2003: An objective climatology, classification scheme, and assessment of sensible weather impacts for Appalachian cold-air damming Weather and Forecasting , 18, 641-661. • Bougeault, P., and Coauthors, 2001: The MAP Special Observing Period. Bull. Amer. Meteor. Soc., 82, 433–462. • Colle, B., Y. Lin, S. Medina, B. Smull, 2008: Orographic modification of convection and flow kinematics by the Oregon coast range and Cascades during IMPROVE-2 . Monthly Weather Review , 136, 3894–3916. • Hanna, J., D. Schultz, and A. Irving , 2008: Cloud-Top Temperatures for Precipitating Winter Clouds . Journal of Applied Meteorology and Climatology, 47, 351–359 • Houze, R., S. Medina, 2005: Turbulence as a Mechanism for Orographic Precipitation Enhancement . Journal of the Atmospheric Sciences , 62, pp. 3599–3623 • James, C., R. Houze, 2005: Modification of Precipitation by Coastal Orography in Storms Crossing Northern California Monthly Weather Review , 133, 3110–3131 • Lundquist, J., P. Neiman, B. Martner, A. White, D. Gottas, F. Ralph , 2008: Rain versus Snow in the Sierra Nevada, California: Comparing Doppler Profiling Radar and Surface Observations of Melting Level Journal of Hydrometeorology , 9, 194–211. • Medina, S., E. Sukovich, R. Houze, 2007: Vertical Structures of Precipitation in Cyclones Crossing the Oregon Cascades Monthly Weather Review , 135, 3565–3586. • Olson. J et al.,2007: A comparison of two coastal barrier jet events along the southeast Alaskan coast during the SARJET field experiment. Mon. Wea. Rev., 135, 3642-3663. • Neiman P. J., F. M. Ralph, A. B. White, D. D. Parrish, J. S. Holloway, and D. L. Bartels, 2006: A midwinter analysis of channeled flow through a prominent gap along the northern California coast during CALJET and PACJET. Mon. Wea. Rev., 134, 1815–1841. • Schultz, D. M., and Coauthors, 2002: Understanding Utah winterstorms: The Intermountain Precipitation Experiment. Bull.Amer. Meteor. Soc., 83, 189–210. • Smith, R. B., 1979: The influence of mountains on the atmosphere. Adv. Geophys, 21, 87-230 • Steenburgh, W. J., 2003: One hundred inches in one hundred hours: Evolution of a Wasatch Mountain winter storm cycle. Wea. Forecasting, 18, 1018-1036. • Steenburgh, J., T. Alcott, 2008: Secrets of the “Greatest Snow on Earth” . Bulletin of the American Meteorological Society, 89, 1285–1293 • Stoelinga, M. T., and Coauthors, 2003: Improvement of microphysical parameterization through observational verification experiment. Bull. Amer. Meteor. Soc., 84, 1807–1826. . • Woods, C., M. Stoelinga, J. Locatelli, P. Hobbs, 2005: Microphysical Processes and Synergistic Interaction between Frontal and Orographic Forcing of Precipitation during the 13 December 2001 IMPROVE-2 Event over the Oregon Cascades Journal of the Atmospheric Sciences , 62, 3493–3519. • Woods, C., M. Stoelinga, J. Locatelli, 2008: Size Spectra of Snow Particles Measured in Wintertime Precipitation in the Pacific Northwest Christopher P. Woods, Mark T. Stoelinga, and John D. LocatelliJournal of the Atmospheric Sciences , 65, 189–205
COMET Module Resources • Flow Interaction with Topography • Thermally-forced Circulation II: Mountain/Valley Breezes • Mountain Waves and Downslope Winds • PBL in Complex Terrain - Part 1 • PBL in Complex Terrain - Part 2 • Gap Winds • Cold Air Damming • Challenges of Forecasting in the West • Dynamics & Microphysics of Cool-Season OrographicStorm • Jim Steenburgh U/Utah
Recent Orographic Precipitation Field and Testbed Programs • CALJET/PACJET (Neiman et al. 2006, Kingsmill et al. 2007) • Mesoscale Alpine Programme (MAP; Bougeault et al. 2001) • Intermountain Precipitation Experiment (IPEX; Schultz et al. 2002) • Improvement of Microphysical Parameterization through Observational Verification Experiment (IMPROVE; Stoelinga et al. 2003) • HydrometeorologicalTestbed West http://hmt.noaa.gov/
Recognizing terrain’s role in the forecast process • Planetary scale • mean ridge and trough positions • Synoptic scale • cyclogenesis and anticyclogenesis • fronts • Mesoscale • Dynamically & thermally driven circulations • Orographic precipitation processes • Local scale • Impacts of local surface inhomogeneities
Does Terrain Improve or Destroy Predictability? Terrain Degraded forecasts Improved forecasts
Does Terrain Improve or Destroy Predictability? Nonlinear scale interactions Incomplete model physics Inadequate model resolution Observations may not be representative Terrain Improved forecasts Degraded forecasts
Does Terrain Improve or Destroy Predictability? Physically-based conceptual models Recognizable spatial dependencies Recurring phenomena Terrain Degraded forecasts Improved forecasts
Does Terrain Improve or Destroy Predictability? Nonlinear scale interactions Incomplete model physics Physically-based conceptual models Inadequate model resolution Recognizable spatial dependencies Observations may not be representative Recurring phenomena Terrain Degraded forecasts Improved forecasts Forecaster has decided advantage over models to improve forecasts when dealing with terrain issues compared to dealing with mesoscale instabilities
Why is Terrain So Important? • If the earth were greatly reduced in size while maintaining its shape, it would be smoother than a billiard ball. (Earth radius = 6371 km; Everest = 8.850 km) • However, the atmosphere is also shallow (scale height ~8.5 km) so mountains are a significant fraction of atmosphere’s depth • And: • Stability gives the atmosphere a resistance to vertical displacements • The lower atmosphere can be rich in water vapor so that slight ascent brings the air to saturation • Example: flow around a 500-m mountain (<< 8.5 km) might lead to 1) broad horizontal excursions, 2) downslope windstorm on lee side, and 3) torrential orographic rain on windward side. Smith, R. B., 1979: The influence of mountains on the atmosphere. Adv. Geophys., 21, 87-230.
Building blocks for orographic storms • Large-scale weather (e.g., cyclones and fronts) • Determines the airmass characteristics, including wind speed, wind direction, stability, and humidity • Dynamics of air motion over and around the mountains • Determines depth and intensity of the orographic ascent • Cloud and precipitation microphysics • Determines if condensation will lead to precipitation See COMET module Dynamics & Microphysics of Cool-Season Orographic Storms
Summary of cold cloud precipitation processes • Condensational growth of cloud droplet • Some accretional growth of cloud droplets • Development of mixed phase cloud as ice nuclei are activated and ice multiplication process occurs • Crystal growth through Bergeron-Findeisen process • Creates pristine ice crystals • Most effective at –10 to –15 C
Summary of cold cloud precipitation processes • Other possible effects • Accretion (riming) of supercooled cloud droplets onto falling ice crystals or snowflakes • Snowflakes will be less pristine or evolve into graupel • Favored by: • Warm temperatures (more cloud liquid water) • Maritime clouds (bigger cloud droplets) • Strong vertical motion • Aggregation • Entwining or sticking of ice crystals
Cloud-top temperature • Hanna et al. (2008) • Steep slope in the snow distribution for cloud-tops warmer than −15°C likely due to the combined effects of: • above-freezing cloud-top temperatures not producing snow, • the activation of ice nuclei • the maximum growth rate for ice crystals at temperatures near −15°C • ice multiplication processes from −3° to −8°C. • Fig. 1. Histograms of cloud-top brightness temperatures (°C) for (a) all snow, (b) light snow, (c) moderate snow, and (d) heavy snow.
Fig. 7. A sample spectral trajectory from a frontal precipitation band off the coast of Washington State (not during IMPROVE), with the growth stages indicated by the shaded regions (from Lo and Passarelli 1982). Many Few Large Small Woods et al. (2008)
Orographic Enhancement • Role of mountains on precipitation can be examined by comparing climatological or storm total precipitation in upstream valleys to that in the mountains • Orographic Enhancement Ratio: • Mountain precipitation/Valley precipitation • Ratio> > 100% then mountains playing significant role enhancing total precipitation
Orographic precipitation mechanisms • Stable upslope • “Seeder-Feeder” • Potential instability release • Sub-cloud evaporation contrasts • Terrain-driven convergence • Terrain-induced thunderstorm initiation Usually multiple mechanisms evolving during storm University of Utah
Stable upslope • Stable (laminar) ascent is forced by flow over a mountain • If air forced over mountain is sufficiently moist through a deep layer, precipitation develops • If not, shallow, non-precipitating clouds develop • Not very efficient if operating alone www.capetownskies.com
Seeder-Feeder Jay Shafer Seeder Cloud • Snow or rain generated in “seeder” clouds aloft falls through low-level orographic “feeder” clouds • Feeder cloud might not otherwise produce precipitation • Precipitation enhanced by collision-coalescence and accretion in feeder cloud • Seeder cloud can be frontal, or orographically generated/enhanced • Common over Cascades, Sierra, and coastal ranges, particularly in pre-frontal environment Feeder Cloud
Sub-cloud evaporation contrasts • Precipitation reaches ground over mountains because layer in which sub-cloud evaporation is occurring is shallower • Common over Great Basin, particularly during periods of stable, overrunning precipitation Jay Shafer
RH=50% RH=75% Sub-cloud evaporation contrasts • Orographic ascent increases RH, resulting in less evaporation over mountains compared to over plains • Further enhances sub-cloud evaporation contrast Jay Shafer
Upslope release of “potential instability” • Potential instability – Special situation where orographic lift triggers convection • Convection may be deep or shallow • both can result in substantial precipitation enhancement • Important for postfrontal snow, or precipitation just ahead of cold front if there’s a pre-frontal surge of cold air aloft
Terrain-driven convergence • Terrain-induced flow produces convergence, lift, and precipitation • Examples • Windward convergence in Wasatch, San Juans, Front Range, Park Range • Ascent shifted upstream of initial mountain slope • Slight reduction in crest-level precipitation • Lee-side convergence zones • e.g., Puget Sound Convergence Zone • Flow converges to lee of Olympics Mass (1981)
Terrain-forced flows • Two types of mountain winds • Diurnal mountain winds (thermally driven circulations): produced by temperature contrasts that form within mountains or between mountains and surrounding plains • Terrain-forced flows: produced when large-scale winds are modified or channeled by underlying complex terrain • Terrain forcing can cause an air flow approaching a barrier to be carried over or around the barrier, to be forced through gaps in the barrier or to be blocked by the barrier. Use COMET modules for further background • See http://meted.ucar.edu/mesoprim/flowtopo/ • See http://meted.ucar.edu/mesoprim/gapwinds/ • See http://meted.ucar.edu/mesoprim/mtnwave/ • Three variables determine this behavior of an approaching flow • Stability of approaching air (Unstable or neutral stability air can be easily forced over a barrier. The more stable, the more resistant to lifting) • Wind speed (Moderate to strong flows are necessary) • Topographic characteristics of barrier
Over or Around? • Potential energy: energy required to lift parcel over obstacle in statically stable environment • PE proportional to stability (N2) * obstacle height (h2) • Kinetic energy: energy available due to air’s motion • KE proportional to wind speed (U2) • Froude number squared: ratio of kinetic energy to potential energy • Fr = U/(Nh) • Fr >> 1 plenty of kinetic energy to lift air over obstacle • Fr << 1 not enough kinetic energy and flow blocked by terrain
Blocking Affect stable air masses and occur most frequently in winter or coastal areas in summer The blocked flow upwind of a barrier is usually shallower than the barrier depth. Air above the blocked flow layer may have no difficulty surmounting the barrier and may respond to the ‘effective topography’ including the blocked air mass. Onset and cessation of blocking may be abrupt Predicting onset often easier than predicting demise
Cold Air Damming:Geostrophic Adjustment Bailey, C. et al., 2003: An Objective Climatology, Classification Scheme, and Assessment of Sensible Weather Impacts for Appalachian Cold-Air Damming Weather and Forecasting , 18, 641-661.
Gap/Barrier Flow Interactions Nieman et al. 2006
Case Study: The “Hundred Inch Storm” • Produced by two major storm systems (22-27 Nov 2001) • Alta, Utah • 100” in 100 hours • 108” storm total • Questions: • What are the primary storm stages? • How do precipitation processes vary between stages? • How does the orographic enhancement vary between stages? • How do precipitation rates and totals vary between stages? Steenburgh, W. J., 2003: One hundred inches in one hundred hours: Evolution of a Wasatch Mountain winter storm cycle. Wea. Forecasting, 18, 1018-1036.
Initial strike – Stable prefrontal stage • Mainly stratiform precipitation • Subcloud sublimation/evaporation limited valley precipitation • Alta/SLC SWE = 217%
Initial strike – Unstable prefrontal stage • Intrusion of cold, dry airaloft produces in convection • Convection not always tied to topography • Smallest orographic enhancement of first storm • Alta/SLC = 180%
Initial strike – Frontal passage • Cold front with trailing precipitation region • Alta/SLC = 218%
Initial strike – Postfrontal stage I • Precipitation became increasingly confined and heaviest to lee of GSL and over Wasatch Mountains • Lake band development • Alta/SLC = 278%
Initial strike – Midlake band • Solitary midlake band • Orographic enhancement in lakeband • Alta/SLC = 241%
Initial strike – Postfrontal Stage II • Scattered snowshowers • Most frequent to lee of GSL • Alta/GSL = 500%
11% 10% PostFront II Lakeband Postfront I Frontal UPF Stable 16% 20% 10% 33% Initial strike summary Upper Cold Front Cold Front 63% of Alta SWE was postfrontal 20% due to orographically enhanced lakeband Additional lake effect in PF1 and PF2
Conceptual Model Cold, Dry Upper Cold Front Cold Front
Physical Mechanisms modulating orographic precipitation • Gravity waves in statically stable environments • Transient turbulent updrafts observed under statically stable conditions in the presence of strong low-level shear • Upstream enhancement in statically stable and blocked-flow conditions • Windward enhancement in potentially unstable cases, which can organize convection into narrow convective bands (adapted from Colle et al. 2008)
Conceptual model of the dynamical and microphysical mechanisms responsible for the orographic enhancement of precipitation during storms with stable stratification. Houze and Medina (2005)
Convective Organization • Observational and modeling studies show that orographic precipitation is enhanced in convective events compared to stratiform events • increased area-averaged precipitation • quasi-stationary banded structures that concentrate most of their rainfall over specific locations. • Common ingredients for band formation • potential instability • High relative humidity • moderate wind speeds in the upstream flow • presence of small-scale topographic obstacles on the terrain upstream of the ridge crest Adapted from Kirshbaum et al. (2007)
Convective banding • Fig. 14. Three-dimensional simulation of band formation. The underlying terrain is green, and the qc = 0.05 g kg−1 contour is light blue. Parcel trajectories at y = 10 km and y = 15 km overlaid on these fields are red (blue) when the parcel’s buoyancy is positive (negative) relative to the nodal line at y = 12.5 km.
Strategies for Forecasting Orographic Precipitation • Take advantage of local observational resources • Station and radar climatologies • Identify kinematic features on meso and local scales