Download
1 / 24
250 likes | 362 Views
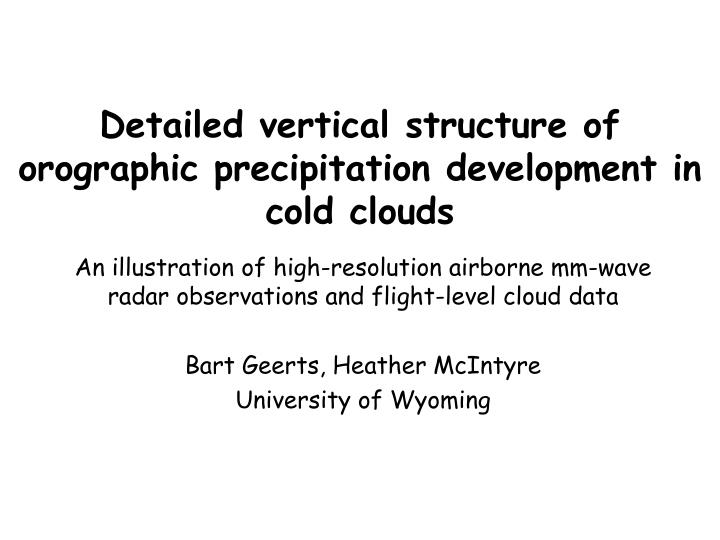
Detailed vertical structure of orographic precipitation development in cold clouds. An illustration of high-resolution airborne mm-wave radar observations and flight-level cloud data Bart Geerts, Heather McIntyre University of Wyoming. Wyoming. target mountain range.

E N D
Detailed vertical structure of orographic precipitation development in cold clouds An illustration of high-resolution airborne mm-wave radar observations and flight-level cloud data Bart Geerts, Heather McIntyre University of Wyoming
Wyoming target mountain range
elevation range 2000-3500 m 50 km Snowy Range Sierra Madre flight legs roughly parallel with wind
Wyoming Cloud Radar • 3 mm (95 GHz, W-band), dual-polarization • pulse width: 250-500 ns • max range: 3-10 km • volume resolution @ 3 km range: < 40 m • minimum detectable signal (@ 1 km): ~-30 dBZ • Cloud droplets are much smaller than ice crystals, thus in a mixed-phase cloud, reflectivity is dominated by ice crystals.
sinking motion rising motion 215552-220402 UTC u PBL turbulence (~1 km deep)
215552-220402 UTC u generating cells? low-level echo intensification across the crest low-level snow outflow
Synoptic situation at this time (20060118, 20 Z) prefrontal, SW flow aloft (UL trof evident to the NW)
The increase in reflectivity sometimes coincides with a sudden drop in LWC. flight level temperature: -16°C surface wind speed near crest: 11 ms-1 wedge of growing reflectivity in upslope PBL, disconnect from snow aloft
January 18,2006 213935-215050 UTCmean values within 10 km from the ridgeflt level 4,400 m MSL, T=-15°C
t=0 Barrett Ridge Med Bow peak t=14 min t=27 min t=40 min flight level temperature: -17°C surface wind speed near crest: 13 ms-1 We need to estimate snow particle trajectories to distinguish between fall-streaks and lofted surface snow Is wind blowing over a snow-covered surface a possible nucleation source?
Battle Mountain Saratoga
Natural seeding by snow-covered surfaces • “surface-induced snowfall” (SIS): snow seems to appear from the surface, and is mixed into the PBL • Rogers and Vali (1987, “Ice Crystal Production by Mountain Surfaces”) found that the air sampled on Elk Mountain contained 10 - 1,000 more ice crystals than the free atmosphere upstream
Natural seeding by snow-covered surfaces • Examination of data collected last winter suggests the following most-likely mechanisms • Lofting of snow from surface • Hallet-Mossop ice splintering when a supercooled drop hits an ice surface • Conditions under which this appears to be most likely are: • Surface covered by fresh snow • Windy (>10 m/s ?) and cold (T<-5°C?) • Possibly: cloud present and tree surfaces are rimed
Post-frontal cumuliform orographic snowfall (2 Feb, 20 UTC) GOES VIS GOES IR upwind (SRT) sounding upwind (SRT) sounding
Post-frontal cumuliform orographic snowfall (2 Feb) 20060202 1900-1912 UTC flight level temperature: -19°C surface wind near crest: 12 ms-1 from NW
upstream views downstream view 21:25 UTC 20060202 21:38 UTC 21:24 UTC
Lee waves (5 Feb) Kennaday Peak Med Bow Peak
conclusions • High-resolution vertical-plane reflectivity and vertical velocity transects reveal a range of orographic precipitation structures. • Pre-frontal: deep precipitation may be distinguished from shallow orographic component. • Post-frontal orographic precip is far more cumuliform, with locally large LWC. • Natural glaciation may be rapid, and can occur both upstream and just downstream of the crest. • Natural seeding may occur by blowing snow or cloud contact with rimed surfaces (SIS).
Further work using winter 06 data • methods: • Estimate snow crystal trajectories from VPDD and an assumed fall speed. • Examine LWC data and 2D particle imagery, in the context of WCR vertical velocity and echo structure • Plot upstream soundings (from WKA and model) and construct summary table • objectives: • Describe snow growth relative to mountain ridge. • Gain clues about snow growth processes (deposition, riming, aggregation) • Examine differences between select cases, in terms of Fr and presence of upstream clouds