Download

1 / 85
850 likes | 885 Views
Perceptual Organization of Contours. James Elder Centre for Vision Research York University Toronto, Canada. CVR Vision Science Summer School. Perceptual Organization of Contours. James Elder Centre for Vision Research York University Toronto, Canada. Perceptual (dis)organization.

E N D
Perceptual Organization of Contours James Elder Centre for Vision Research York University Toronto, Canada
Perceptual Organization of Contours James Elder Centre for Vision Research York University Toronto, Canada
Perceiving Oriented Textures (Joint work with Charles Or)
Motivation • Local orientation selectivity is well understood • Physiology: e.g., Hubel & Wiesel (1962) • Psychophysics: e.g., Blakemore et al. (1970), Campbell & Kulikowski (1966) • How do we integrate local orientation signals over image regions to extract information about texture flows?
Stimulus Horizontal Glass pattern Horizontal line pattern
Method • Human psychophysics: Detection threshold from Yes/No task • Ideal observer: Normative model with optimal performance • To normalize human data • Classification image analysis: To identify sources of inefficiency in oriented texture detection
Stimulus • Stimulus: Glass pattern or line pattern • 200 elements • # of orientations: 6, 12, 24 • Signal orientation: horizontal, oblique • Stimulus size: 7 deg radius • Human detection threshold • By varying the signal level using the adaptive QUEST procedure
Stimuli Horizontal Glass pattern Horizontal line pattern Oriented noise
Stimulus # orientations = 6 12 24 signal signal signal # of elements noise noise noise element orientation (deg)
Experiment: Yes/No task fixation Stimulus displayed for 165 ms (either signal+noise or noise only) Response
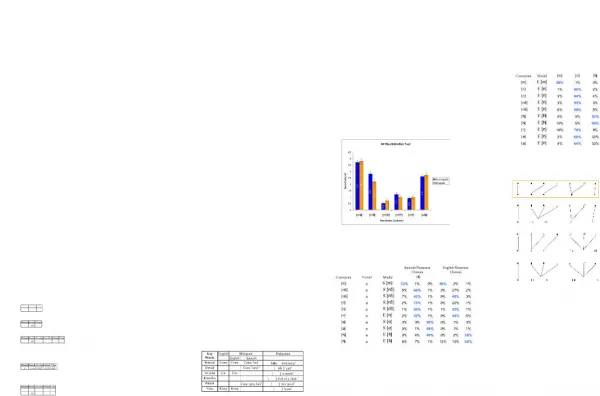
Results: Human thresholds Observer: DN Signal: horizontal Observer: DN Signal: oblique 60 40 # of signal elements at threshold 20 0 5 10 15 20 25 5 10 15 20 25 # of orientations Threshold for line pattern is much lower than for Glass pattern Correspondence error Glass pattern Line pattern
Ideal observer • Ideal observer has: • Perfectorientation acuity • Perfectspatial acuity • Consequence: Correspondence error is negligible • Ideal strategy: • Count number n0 of elements at signal orientation • If n0 > nt : Respond “present” • If n0 < nt : Respond “absent” • Big Question: What is the ideal threshold nt? • Main Issue • The ideal threshold nt depends upon the true signal level (the number of signal elements). • The signal level is adapted from trial to trial based on QUEST • Unrealistic to expect any observer to know the exact signal level on a given trial • Solution: bound the ideal observer: • Ideal 1 (optimistic): Exact signal level is known • Ideal 2 (pessimistic): Assume flat prior (marginalize over unknown signal level)
Human (Glass) Human (line) Ideal 1 Ideal 2 Ideal thresholds Observer: DN Signal: horizontal Observer: DN Signal: oblique 60 40 # of signal elements at threshold 20 0 5 10 15 20 25 5 10 15 20 25 # of orientations Human performance for line stimuli is still far from ideal
– # of elements = element orientation (deg) element orientation (deg) Classification image analysis • We estimate inefficiency due to orientation uncertainty with classification images in the orientation domain • We analyze signal-absent classification image:
# orientations: 6 Orientation Classification Images 6 # orientations: 24 Conditions: - Stimulus: line - Signal: horizontal - Averaged over observers 4 # of elements 2 0 -2 -100 -50 0 50 100 -100 -50 0 50 100 element orientation (deg) Orientation uncertainty: Human also uses noise elements at neighbouring orientations of the signal orientation A peak at the signal orientation: Human uses noise elements at signal orientation
Effects of dipole eccentricity eccentricity r
Eccentricity classification image 0.7 0.7 Observer: YM Stimulus: Line Signal: horizontal # Orientations: 12 0.6 0.6 0.5 0.5 0.4 0.4 Signal dipole weight w 0.3 0.3 0.2 0.2 0.1 0.1 0 0 - - 0.1 0.1 0 0 1 1 2 2 3 3 4 4 5 5 6 6 7 7
Glass pattern stimulus • Signal orientation: horizontal • Signal strength: 27% (mean threshold)
Eccentricity-Filtered mean human space constant = 0.8 deg
The effective (perceived) signal mean human space constant = 0.8 deg
Efficiency • We define human efficiency as efficiency = ( thresholdideal / thresholdhuman )2
Summary • 3 sources of inefficiency identified: • Correspondence error • Orientation uncertainty • Decline in sensitivity with eccentricity • These sources of error appear to account for most of the inefficiency in human oriented texture detection
Perceiving contours: Limitations Elder & Morgenstern, 2003
Human efficiency declines with contour length 7000 Ideal Participant 1 Pooled 0.6 0.6 Participant 1 Participant 2 6000 Participant 2 0.5 0.5 5000 0.4 0.4 4000 Efficiency Efficiency Number of elements at threshold 0.3 0.3 3000 0.2 0.2 2000 0.1 0.1 1000 0 0 0 0 5 10 0 5 10 0 5 10 Path length Path length Path length Elder & Morgenstern, 2003
Computational Models of Contour Grouping • Probabilistic foundations • Limitations • A promising direction (Joint work with Francisco Estrada)
Markov Chain Model • Model contours as Markov chains: assume long-range statistics completely determined by local statistics.
li1 lj1 r li2 lj2 ij t t i j Gestalt Cues: Contours
Gestalt Cues: Natural Image Statistics Elder & Goldberg, 2002
Generative Model Is this enough?
Problem: Natural images are rich in detail – leads to large searchspace
A Possible Solution: Top-Down Guidance • Suppose you know the kind of thing you are looking for (guided search).
Contour Grouping with Prior Models (Elder, Krupnik & Johnston, 2003) • Grouping Cues • Proximity • Good Continuation • Luminance Similarity • Object cues: • Distance between tangent and model • Angle between tangent and model • Distance between tangent and nearest neighbouring tangent on dark side • Intensity on dark side of tangent
Posterior Prior Statistical Power of Object Cues