Download
1 / 18
180 likes | 204 Views
This article discusses the indicators that present relevant information on trends in a readily understandable way for sustainable water resources. It covers various factors for identifying and choosing indicators, as well as different indicators related to water availability, quality, allocation, consequences, effects on people, and important factors affecting water resources.

E N D
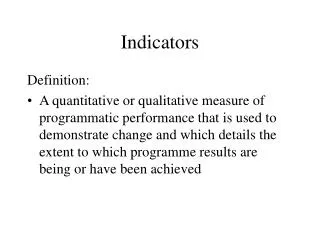
Considering the Indicators Indicator definition: Measures that present relevant information on trends in a readily understandable way
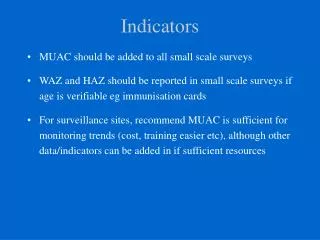
Factors(for identifying and choosing indicators) • Consider the condition and capacity of ecological, social and economic systems - direction and rate of change; interactions • Focus on what’s most relevant to sustainability • Adopt appropriate time horizon and scale • Demonstrate integrity - measurable, unbiased, scientifically defensible, spatially explicit • Be understandable
SWRR Indicators(17 total: this is a starting point) A. System Capacities, Quality, and Allocation 1. Gross water availability 2. Total withdrawals for human uses 3. Water in the environment (what’s left) 4. Water quality 5. Total capacity to store, deliver, and treat the water supply over unit of time 6. Social and organizational capacity
SWRR Indicators (con’d) B. Consequences of the Way We Allocate Water Capacity 7. Environmental conditions 8. Resources and conditions (e.g. fish contamination) 9. Quality and quantity of water for human uses (for different sectors) 10. Resources withdrawals and use - uses of harvested resources - uses of non-harvested water-dependent resources
SWRR Indicators (con’d) C. Effects on People of the Conditions and Uses of Water Resources 11. Human conditions - measures of value people receive from uses of water and the costs incurred D. Important Factors Affecting Water Resources 12. Land use 13. Residual flows (point and nonpoint sources) 14. Social and economic processes 15. Ecosystem (environmental) processes
SWRR Indicators (con’d) E. Composite Sustainability Assessment 16. Water use sustainability 17. Water quality sustainability
Indicator Approach 1. What is this indicator? 2. Why is it important? 3. What do the data show?
Example 1: Indicator 1 (Gross Water Availability) Available precipitation minus potential ET (1934-2002) Source: Roy, Summers, and Goldstein, SWRR presentation, March, 2004
Example 2: Indicator 7 (Environmental Conditions) Overall national and regional coastal condition between 1997 and 2000 Source: U.S. EPA, December 2004. National Coastal Condition Report II. Office of Research and Development/Office of Water. EPA-620/R-03/002.
Example 3a: Indicator 8 (Resources and Conditions) Contamination of Fish and Wildlife: # of Advisories in Effect, 1998 Source: U.S. EPA, National Water Quality Inventory 1998 Report
Example 3b: Indicator 8 (Resources and Conditions) Summary of Use Support in Assessed Rivers and Streams Source: 1998 U.S. EPA State and Tribal Section 305b Report
Example 4a: Indicator 11 (Human Conditions) Percent of the Population Lacking Complete Plumbing by StateSource: Rural Community Assistance Partnership. 2004. Still Living without the Basics in the 21st Century.
Example 4b: Indicator 11 (Human Conditions) Adapted From: Surveillance for Waterborne Disease Outbreaks - US, 1997-1998 Accessible at: http://www.cdc.gov/mmwr/preview/mmwrhtml/ss4904al.htm
Other Indicators? 1. Are the categories appropriate / inclusive? 2. Are there other indicators that should be included? 3. Are there better data sets / information?
Questions • What water information and statistics are needed to develop indicators? • What sources of data or statistics should be considered for developing indicators of sustainable water resources? • If new data should be collected for these indicators, what organizations should do it and why? What gaps exist?
Breakout Groups • Review each of the indicators • Take regional considerations into account, if appropriate