Download
1 / 33
330 likes | 425 Views
Preliminary F0 Statistics for Young Swedish Males and Forensic Phonetics. Jonas Lindh – jonas.lindh@ling.gu.se http://www.ling.gu.se/~jonas Department of Linguistics, Göteborg University and GSLT (Graduate School of Language Technology) IAFPA 2006. Outline. Background and Introduction

E N D
Preliminary F0 Statistics for Young Swedish Males and Forensic Phonetics Jonas Lindh – jonas.lindh@ling.gu.se http://www.ling.gu.se/~jonas Department of Linguistics, Göteborg University and GSLT (Graduate School of Language Technology) IAFPA 2006
Outline • Background and Introduction • F0 and Forensic Phonetics • Modulation theory of speech • Hypotheses • Methods • Results • F0 Statistics – for Young Swedish males • Robustness test • Vocal effort test. • Liveliness illustration. • Conclusions • Future Work
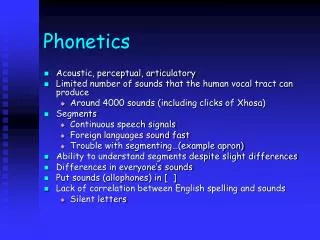
Background and Introduction • F0 a reliable parameter for speaker identification (French, 1990 ; Hollien, 1990 ; Künzel, 1987 ; Nolan, 1983 - in Braun, 1995). • Technical, physiological and psychological factors (Braun, 1995). • Fundamental frequency measures. • Some previous studies and results.
Background and Introduction (Braun, 1995) • Technical factors • Tape speed unfortunately still a problem. • Sample durations (50, 75, 14, 120 s?). • Physiological factors • Age, smoking, operations. • Larynx size, shape and mass. • Between speaker variation. • Psychological factors • Noise level, emotions, time of the day. • Vocal effort, speaking rate, F0-dynamics, voice quality • Within speaker variation
Background and Introduction • Fundamental frequency measures • Average • Standard deviation • Median • Interquartile range • F0 mode • Base value! Modulation theory of speech.
Modulation theory of speech • The theory /…/ considers speech signals as the result of allowing conventional gestures to modulate a carrier signal that has the personal characteristics of the speaker. This implies that in general the conventional information can only be retrieved by demodulation. In order to perceive the phonetic quality of a speech signal, listeners evaluate the deviations of the properties of the signal (F0, formant frequencies, etc.) from those they expect of a neutral vocalization produced by the speaker with properties given by his age, sex, vocal effort, speech rate, etc. (part of abstract -Traunmüller, 1994)
F0 Liveliness Average F0‑variation (SD in semitones) as a function of the type of speech as classified in. Under ‘Type’, the speech samples are classified according to their expected liveliness (Traunmüller & Eriksson, 1995).
F0 Liveliness (Traunmüller & Eriksson, 1995) • The SD of F0 increases with increasing ‘liveliness’ of the discourse. • The SD of F0 seems to be larger in tone languages than in non‑tone languages.
F0 baseline (Traunmüller & Eriksson, 1995) • Fb = Fmean – k (F) • Where k is a constant (app. 1.43). • App. 5% F0 values below Fb . • Different liveliness, same Fb . • Tested by changing the factor and not Fb when resynthesizing natural speech. • ke = 0.156, 0.414, 0.704, 1.000, 1.290, 1.566, 1.830 • “Det finns folkstammar som äter både kattkött och hundkött”.
Hypotheses concerning F0 for young Swedish males • The F0 median is more robust than the F0 mean when it comes to technical factors, i.e. less sensitive to outliers. • The base value shows least within speaker variation of presented measures within a voice modality. (creaky voice, shouting or raising one’s voice) • The 5% limit frequency (alternative baseline) is more robust than the base value when the technical factor means positive octave jumps.
Methods • The software Praat (Boersma & Weenink, 2005) was used to automatically extract F0 data from 109 young male speakers (20-30 years old). • The group exist as such in the Swedia database. • 62% of convicted criminals in Sweden 2004 (25-35). • The recordings were taken from the Swedia database (<http://www.swedia.nu>) – spontaneous speech. • Mean duration of 52.3 sec.
Methods • Edited out interviewer. • Manual check of octave jumps. • Ongoing is the collection of 5% limit frequency, F0 mode (histograms for each speaker’s F0 distribution) and interquartile range.
Methods • A small robustness test was made by measuring F0 for simultaneous recording on four different devices (material Livijn, 2004). • The North wind and the sun (in Swedish). • MCA, Cassette, Mobile and digital (Reference).
Methods • Vocal effort test. • 5 male speakers from Eriksson & Traunmüller (2000) • High quality recordings. • 5 distances/subject outdoors (0,3-1,5-7,5-37,5-187,5m) • “Jag tog ett violett, åtta svarta och sex vita.”
Methods • A liveliness illustration • Recordings of a simulated carrier signal + a neutral, happy, sad and angry voice.
Results • Mean of means 120,8 Hz – 65% between 100-130 Hz
Results • Mean of medians 115,8 Hz – 68% between 100-130 Hz
Results • Mean of std’s 24,1 Hz – 56% between 10-25 Hz
Results • Mean of baselines 86,3 Hz – 68% between 70-100 Hz
Conclusions • The median is more robust than the mean when it comes to technical factors, i.e. less sensitive to outliers. • Yes. Manual check and results confirm this. • The base value shows least within speaker variation of presented measures within a voice modality. • Yes. Shouting or raising one’s voice can mean raising one’s base value. • 68% within 30 Hz, same as median. • The 5% limit frequency is more robust than the base value when the technical factor means positive octave jumps. • Yes. Robustness test.
Conclusions • F0 should be measured in case work. • If baseline values are different there should be a reasonable explanation for it not to indicate speaker difference. • Such as ‘voice modality’ (creak, shout etc.) differences.
Future work • F0 mode (ongoing) and individual histograms. • More measures on different “liveliness” levels for same and different speakers on different recording devices. • Sample size vs. content. • Authentic case material. • Separate study of creaky voice.
Thank you for your attention. Questions? jonas@ling.gu.se http://www.ling.gu.se/~jonas
References Boersma, P. & Weenink, D. (2005) Praat: doing phonetics by computer (Version 4.3.27) [Computer program] Retrieved October 7, 2005, from http://www.praat.org/ Braun, A. (1995) Fundamental frequency – how speaker-specific is it?, in Braun and Köster (eds) (1995): 9-23 Brottsförebyggande Rådet: [www] Retrieved November 26, 2005, from http://www.bra.se/ Bruce, G. (1982) Developing the Swedish Intonation Model. In Working Papers 22 (Lund University, Dep of Linguistics, 51-116. Jassem, W., Steffen-Batog, S., and Czajka, M. (1973) Statistical characteristics short-term average F0 distributions as personal voice features, in W. Jassem (ed.) (1973) Speech Analysis and Synthesis vol. 3:209-25, Warsaw: Polish Academy of Science. Kitzing, P. (1979) Glottografisk frekvensindikering: En undersökningsmetod för mätning avröstläge och röstomfång samt framställning av röstfrekvensdistributionen (Lund University,Malmö) Nolan, F. (1983) The Phonetic Bases of Speaker Recognition, Cambridge: Cambridge University Press. Traunmüller, H. (1994) Conventional, biological, and environmental factors in speech communication: A modulation theory. Phonetica 51: 170 - 183. Traunmüller, H. & Eriksson, A. (1995) The frequency range of the voice fundamental in the speech of male and female adults. Unpublished Manuscript (can be retrieved from http://www.ling.su.se/staff/hartmut/aktupub.htm) Traunmüller, H. & Eriksson, A. (1995) The perceptual evaluation of F0-excursions in speech as evidenced in liveliness estimations. J. Acoust. Soc. Am. 97: 1905 - 1915. Hartmut Traunmüller and Anders Eriksson (2000) "Acoustic effects of variation in vocal effort by men, women, and children", J. Acoust Soc. Am. 107: 3438 - 3451. Rose, P. (2002) Forensic Speaker Identification. New York, Taylor & Francis. Rose, P. (1991) How effective are long term mean and standard deviation as normalisation parameters for tonal fundamental frequency?, Speech Communication 10:229-247