Download
1 / 227
2.27k likes | 2.57k Views
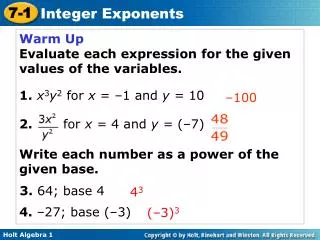
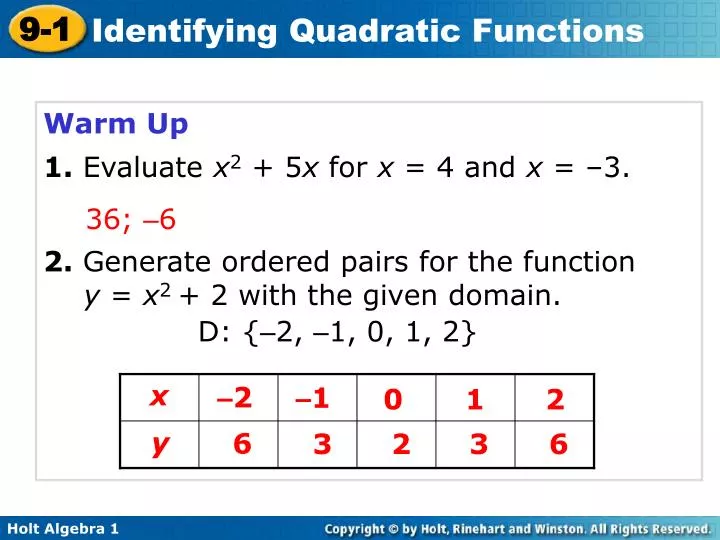
x. – 2 . – 1 . 0 . 1 . 2 . y. 6. 3. 2. 3. 6. Warm Up 1. Evaluate x 2 + 5 x for x = 4 and x = –3. . 36; – 6 . 2. Generate ordered pairs for the function y = x 2 + 2 with the given domain. . D: { – 2, – 1, 0, 1, 2} . Objectives.

E N D
x –2 –1 0 1 2 y 6 3 2 3 6 • Warm Up • 1. Evaluate x2 + 5x for x = 4 and x = –3. 36; –6 2. Generate ordered pairs for the function y = x2 + 2 with the given domain. D: {–2, –1, 0, 1, 2}
Objectives Identify quadratic functions and determine whether they have a minimum or maximum. Graph a quadratic function and give its domain and range.
The function y = x2 is shown in the graph. Notice that the graph is not linear. This function is a quadratic function. A quadratic function is any function that can be written in the standard form y = ax2 + bx + c, where a, b, and c are real numbers and a ≠ 0. The function y = x2 can be written as y = 1x2 + 0x + 0, where a = 1, b = 0, and c = 0.
In Lesson 5-1, you identified linear functions by finding that a constant change in x corresponded to a constant change in y. The differences between y-values for a constant change in x-values are called first differences.
Notice that the quadratic function y = x2 does not have constant first differences. It has constant second differences. This is true for all quadratic functions.
Example 1A: Identifying Quadratic Functions Tell whether the function is quadratic. Explain. Since you are given a table of ordered pairs with a constant change in x-values, see if the second differences are constant. x y –2 –9 +1 +1 +1 +1 +7 +1 +1 +7 –6 +0 +6 –1 –2 0 –1 Find the first differences, then find the second differences. 1 0 2 7 The function is not quadratic. The second differences are not constant.
Caution! Be sure there is a constant change in x-values before you try to find first or second differences.
Example 1B: Identifying Quadratic Functions Tell whether the function is quadratic. Explain. Since you are given an equation, use y = ax2 + bx+ c. y = 7x + 3 This is not a quadratic function because the value of a is 0.
y– 10x2 = 9 + 10x2 +10x2 y = 10x2 + 9 Example 1C: Identifying Quadratic Functions Tell whether the function is quadratic. Explain. y– 10x2 = 9 Try to write the function in the form y = ax2 + bx + c by solving for y. Add 10x2 to both sides. This is a quadratic function because it can be written in the form y = ax2 + bx + c where a = 10, b = 0, and c =9.
Helpful Hint Only a cannot equal 0. It is okay for the values of b and c to be 0.
Check It Out! Example 1a Tell whether the function is quadratic. Explain. Since you are given a table of ordered pairs with a constant change in x-values, see if the second differences are constant. x y –2 4 +1 +1 +1 +1 –3 –1 +1 +3 +2 +2 +2 –1 1 0 0 Find the first differences, then find the second differences. 1 1 2 4 The function is quadratic. The second differences are quadratic.
y + x = 2x2 –x–x y = 2x2–x Check It Out! Example 1b Tell whether the function is quadratic. Explain. y + x = 2x2 Try to write the function in the form y = ax2 + bx + c by solving for y. Subtract x from both sides. This is a quadratic function because it can be written in the form y = ax2 + bx + c where a = 2, b = –1, and c = 0.
The graph of a quadratic function is a curve called a parabola. To graph a quadratic function, generate enough ordered pairs to see the shape of the parabola. Then connect the points with a smooth curve.
x y 4 3 –2 1 3 –1 0 0 1 3 1 4 3 2 Example 2A: Graphing Quadratic Functions by Using a Table of Values Use a table of values to graph the quadratic function. Make a table of values. Choose values of x and use them to find values of y. Graph the points. Then connect the points with a smooth curve.
x y –2 –16 –1 –4 0 0 1 –4 2 –16 Example 2B: Graphing Quadratic Functions by Using a Table of Values Use a table of values to graph the quadratic function. y = –4x2 Make a table of values. Choose values of x and use them to find values of y. Graph the points. Then connect the points with a smooth curve.
x y –2 6 –1 3 0 2 1 3 2 6 Check It Out! Example 2a Use a table of values to graph each quadratic function. y = x2 + 2 Make a table of values. Choose values of x and use them to find values of y. Graph the points. Then connect the points with a smooth curve.
x y –2 –11 –1 –2 0 1 1 –2 2 –11 Check It Out! Example 2b Use a table of values to graph the quadratic function. y = –3x2 + 1 Make a table of values. Choose values of x and use them to find values of y. Graph the points. Then connect the points with a smooth curve.
As shown in the graphs in Examples 2A and 2B, some parabolas open upward and some open downward. Notice that the only difference between the two equations is the value of a. When a quadratic function is written in the form y = ax2 + bx + c, the value of a determines the direction a parabola opens. • A parabola opens upward when a > 0. • A parabola opens downward when a < 0.
Write the function in the form y = ax2 + bx + c by solving for y. Add to both sides. Example 3A: Identifying the Direction of a Parabola Tell whether the graph of the quadratic function opens upward or downward. Explain. Identify the value of a. Since a> 0, the parabola opens upward.
Example 3B: Identifying the Direction of a Parabola Tell whether the graph of the quadratic function opens upward or downward. Explain. y = 5x– 3x2 Write the function in the form y = ax2 + bx + c. y = –3x2 + 5x a = –3 Identify the value of a. Since a< 0, the parabola opens downward.
Check It Out! Example 3a Tell whether the graph of the quadratic function opens upward or downward. Explain. f(x) = –4x2 – x + 1 f(x) = –4x2 – x + 1 Identify the value of a. a = –4 Since a < 0 the parabola opens downward.
The highest or lowest point on a parabola is the vertex. If a parabola opens upward, the vertex is the lowest point. If a parabola opens downward, the vertex is the highest point.
A. B. Example 4: Identifying the Vertex and the Minimum or Maximum Identify the vertex of each parabola. Then give the minimum or maximum value of the function. The vertex is (–3, 2), and the minimum is 2. The vertex is (2, 5), and the maximum is 5.
a. b. Check It Out! Example 4 Identify the vertex of each parabola. Then give the minimum or maximum value of the function. The vertex is (–2, 5) and the maximum is 5. The vertex is (3, –1), and the minimum is –1.
Unless a specific domain is given, you may assume that the domain of a quadratic function is all real numbers. You can find the range of a quadratic function by looking at its graph. For the graph of y = x2 – 4x + 5, the range begins at the minimum value of the function, where y = 1. All the y-values of the function are greater than or equal to 1. So the range is y 1.
Example 5: Finding Domain and Range Find the domain and range. Step 1 The graph opens downward, so identify the maximum. The vertex is (–5, –3), so the maximum is –3. Step 2 Find the domain and range. D: all real numbers R: y ≤ –3
Check It Out! Example 5a Find the domain and range. Step 1 The graph opens upward, so identify the minimum. The vertex is (–2, –4), so the minimum is –4. Step 2 Find the domain and range. D: all real numbers R: y ≥ –4
5 Minute Warm-up Use the graph for Problems 1-3. 1. Identify the vertex. 2. Does the function have a minimum or maximum? What is it? 3. Find the domain and range. (5, –4) max; –4 D: all real numbers; R: y ≤ –4
Warm Up Find the x-intercept of each linear function. 1. y = 2x – 3 2. 3. y = 3x + 6 Evaluate each quadratic function for the given input values. 4. y = –3x2 + x – 2, when x = 2 5. y = x2 + 2x + 3, when x = –1 –2 –12 2
Objectives Find the zeros of a quadratic function from its graph. Find the axis of symmetry and the vertex of a parabola.
Recall that an x-intercept of a function is a value of x when y = 0. A zero of a function is an x-value that makes the function equal to 0. So a zero of a function is the same as an x-intercept of a function. Since a graph intersects the x-axis at the point or points containing an x-intercept, these intersections are also at the zeros of the function. A quadratic function may have one, two, or no zeros.
Check y =x2 – 2x – 3 y =(–1)2 – 2(–1) – 3 = 1 + 2 – 3 = 0 y =32 –2(3) – 3 = 9 – 6 – 3 = 0 Example 1A: Finding Zeros of Quadratic Functions From Graphs Find the zeros of the quadratic function from its graph. Check your answer. y = x2 – 2x – 3 The zeros appear to be –1 and 3.
Example 1B: Finding Zeros of Quadratic Functions From Graphs Find the zeros of the quadratic function from its graph. Check your answer. y = x2 + 8x + 16 Check y =x2 + 8x + 16 y =(–4)2 + 8(–4) + 16 = 16 – 32 + 16 = 0 The zero appears to be –4.
Helpful Hint Notice that if a parabola has only one zero, the zero is the x-coordinate of the vertex.
Example 1C: Finding Zeros of Quadratic Functions From Graphs Find the zeros of the quadratic function from its graph. Check your answer. y = –2x2 – 2 The graph does not cross the x-axis, so there are no zeros of this function.
Check y =x2 – 6x + 9 y =(3)2 – 6(3) + 9 = 9 – 18 + 9 = 0 Check It Out! Example 1b Find the zeros of the quadratic function from its graph. Check your answer. y = x2 – 6x + 9 The zero appears to be 3.
A vertical line that divides a parabola into two symmetrical halves is the axis of symmetry. The axis of symmetry always passes through the vertex of the parabola. You can use the zeros to find the axis of symmetry.
Example 2: Finding the Axis of Symmetry by Using Zeros Find the axis of symmetry of each parabola. A. (–1, 0) Identify the x-coordinate of the vertex. The axis of symmetry is x =–1. B. Find the average of the zeros. The axis of symmetry is x =2.5.
Check It Out! Example 2 Find the axis of symmetry of each parabola. a. (–3, 0) Identify the x-coordinate of the vertex. The axis of symmetry is x =–3. b. Find the average of the zeros. The axis of symmetry is x =1.
If a function has no zeros or they are difficult to identify from a graph, you can use a formula to find the axis of symmetry. The formula works for all quadratic functions.
Step 2. Use the formula. The axis of symmetry is Example 3: Finding the Axis of Symmetry by Using the Formula Find the axis of symmetry of the graph of y = –3x2 + 10x + 9. Step 1. Find the values of a and b. y = –3x2 + 10x + 9 a = –3, b = 10
Step 2. Use the formula. The axis of symmetry is . Check It Out! Example 3 Find the axis of symmetry of the graph of y = 2x2 + x + 3. Step 1. Find the values of a and b. y = 2x2 + 1x + 3 a = 2, b = 1
Once you have found the axis of symmetry, you can use it to identify the vertex.
Step 3 Write the ordered pair. (–4, –1) Example 4A: Finding the Vertex of a Parabola Find the vertex. y = 0.25x2 + 2x + 3 Step 1 Find the x-coordinate of the vertex. The zeros are –6 and –2. Step 2 Find the corresponding y-coordinate. Use the function rule. y = 0.25x2 + 2x + 3 = 0.25(–4)2 + 2(–4) + 3 = –1 Substitute –4 for x . The vertex is (–4, –1).
Example 4B: Finding the Vertex of a Parabola Find the vertex. y = –3x2 + 6x – 7 Step 1 Find the x-coordinate of the vertex. a = –3,b = 6 Identify a and b. Substitute –3 for a and 6 for b. The x-coordinate of the vertex is 1.
Example 4B Continued Find the vertex. y = –3x2 + 6x – 7 Step 2 Find the corresponding y-coordinate. y = –3x2 + 6x – 7 Use the function rule. = –3(1)2 + 6(1) – 7 Substitute 1 for x. = –3 + 6 – 7 = –4 Step 3 Write the ordered pair. The vertex is (1, –4).
Check It Out! Example 4 Find the vertex. y = x2– 4x– 10 Step 1 Find the x-coordinate of the vertex. a = 1,b = –4 Identify a and b. Substitute 1 for a and –4 for b. The x-coordinate of the vertex is 2.
Check It Out! Example 4 Continued Find the vertex. y = x2– 4x– 10 Step 2 Find the corresponding y-coordinate. y = x2 – 4x – 10 Use the function rule. =(2)2 – 4(2) – 10 Substitute 2 for x. = 4 – 8 – 10 = –14 Step 3 Write the ordered pair. The vertex is (2, –14).