Download
1 / 17
170 likes | 300 Views
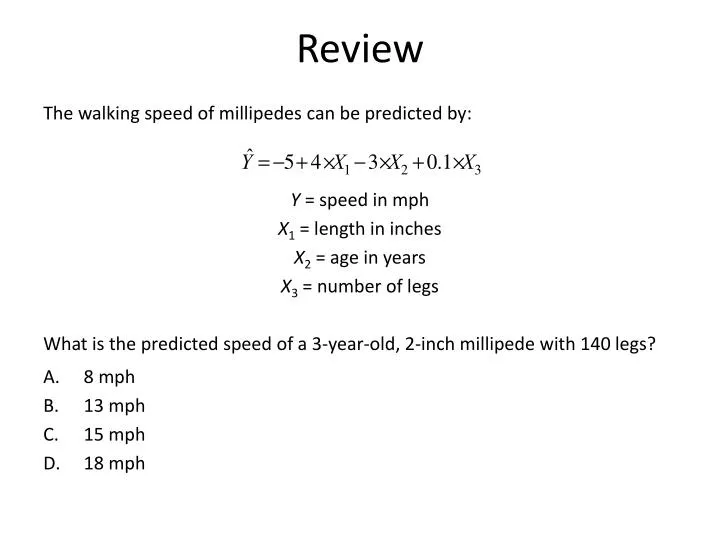
Review. The walking speed of millipedes can be predicted by: Y = speed in mph X 1 = length in inches X 2 = age in years X 3 = number of legs What is the predicted speed of a 3-year-old, 2-inch millipede with 140 legs? 8 mph 13 mph 15 mph 18 mph. Review.

E N D
Review The walking speed of millipedes can be predicted by: Y = speed in mph X1 = length in inches X2 = age in years X3 = number of legs What is the predicted speed of a 3-year-old, 2-inch millipede with 140 legs? • 8 mph • 13 mph • 15 mph • 18 mph
Review The walking speed of millipedes can be predicted by: Y = speed in mph X1 = length in inches X2 = age in years X3 = number of legs The standard error for the first coefficient is Calculate a t statistic for testing whether speed really depends on length. • 0.5 • 2.0 • 6.0 • 8.0
Review A sample of two variables, X and Y, shows a correlation of r = 0.4. The total variability of Y is SSY = 250. What is the residual variability, SSresidual, when Y is regressed on X? • 40 • 90 • 100 • 150 • 210
Analysis of Variance 11/7
Comparing Several Groups • Do the group means differ? • Naive approach • Independent-samples t-tests of all pairs • Each test doesn't use all data Less power • 10 total tests Greater chance of Type I error • Analysis of Variance (ANOVA) • Single test for any group differences • Null hypothesis: All means are equal • Works using variance of the sample means • Also based on separating explained and unexplained variance
Variance of Sample Means • Say we have k groups of n subjects each • Want to test whether mi are all equal for i = 1,…,k • Even if all population means are equal, sample means will vary • Central limit theorem tells how much: • Compare actual variance of sample means to amount expected by chance • or • Estimate s2 using MSresidual • Test statistic: • If F is large enough • Sample means vary more than expected by chance • Reject null hypothesis m M1 M3 M2 Mk
Residual Mean Square • Best estimate of population variance, s2 • Based on remaining variability after removing group differences • Extends MS for independent-samples t-test 2 groups: k groups:
Example: Lab Sections • Group means: • Variance of group means: • Var(M) expected by chance: • Instead: • Estimate of s2: • Ratio of between-group variance to amount expected by chance: p = .44 P(F4, 105) Fcrit = 2.46 F = .96 F = .96
Partitioning Sum of Squares • General approach to ANOVA uses sums of squares • Works with unequal sample sizes and other complications • Breaks total variability into explained and unexplained parts • SStotal • Sum of squares for all data, treated as a single sample • Based on differences from grand mean, • SSresidual (SSwithin) • Variability within groups, just like with independent-samples t-test • Not explainable by group differences • SStreatment (SSbetween) • Variability explainable by difference among groups • Treat each datum as its group mean and take difference from grand mean
Magic of Squares M1 SStotal = S(X–M)2 SStreatment = Si(ni(Mi–M)2) ×5 M3 M ×5 SSresidual = Si(S(Xi–Mi)2) ×6 ×4 M4 M2
Test Statistic for ANOVA • Goal: Determine whether group differences account for more variability than expected by chance • Same approach as with regression • Calculate Mean Square: • H0: MStreatment≈ s2 • Estimate s2 using • Test statistic:
Lab Sections Revisited • Two approaches • Variance of section means • Mean Square for treatment (lab section) • Variance of group means • Var(76.6 82.5 83.7 79.5 82.9) = 8.69 • Expected by chance: s2/22 • Var(M) vs. s2/22, or 22*var(M) vs. s2 • Mean Square for treatment 22 mean(M) `
Two Views of ANOVA • Simple: Equal sample sizes • General: Using sums of squares m M1 M3 M2 Mk If sample sizes equal:
Degrees of Freedom dftreatment=k – 1 SStotal dftotal=Sni – 1 dfresidual=S(ni – 1) =Sni – k.
Review Do groups differ in amount of sleep? Find the sum of squares between groups, SStreatment • 2.86 • 5.81 • 26.13 • 37.22
Review Do groups differ in amount of sleep? SStreatment = 26.13 SStotal = 64.93 Find the sum of squares within groups, SSresidual • 0.402 • 2.485 • 38.80 • 91.06
Review Do groups differ in amount of sleep? Finish the table • MStreatment = 13.06, MSresidual = 3.88, F = 3.36 • MStreatment = 13.06, MSresidual = 3.88, F = 0.30 • MStreatment = 52.26, MSresidual = 388.0, F = 0.13 • MStreatment = 52.26, MSresidual = 388.0, F = 7.42 Density p = .08 3.36