Download
1 / 49
500 likes | 718 Views
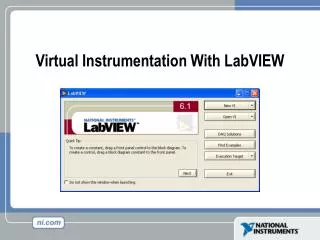
Virtual Instrumentation With LabVIEW. Course Goals. Understand the components of a Virtual Instrument Introduce LabVIEW and common LabVIEW functions Build a simple data acquisition application Create a subroutine in LabVIEW. Section I. LabVIEW terms Components of a LabVIEW application

E N D
Course Goals • Understand the components of a Virtual Instrument • Introduce LabVIEW and common LabVIEW functions • Build a simple data acquisition application • Create a subroutine in LabVIEW
Section I • LabVIEW terms • Components of a LabVIEW application • LabVIEW programming tools • Creating an application in LabVIEW
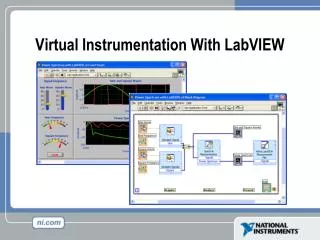
LabVIEW Programs Are Called Virtual Instruments (VIs) • Front Panel • Controls = Inputs • Indicators = Outputs • Block Diagram • Accompanying “program” for front panel • Components “wired” together
VI Front Panel PanelToolbar Boolean Control Double Indicator Waveform Graph
VI Block Diagram Thermometer Terminal Call to subVI Temperature Graph Knob Terminal Numeric Constant WhileLoop Stop Button Terminal Stop Loop Terminal
Controls and Functions Palettes Controls Palette (Panel Window) Functions Palette (Diagram Window) Graphical, floating palettes Used to place controls & indicators on the front panel, or to build the block diagram
Tools Palette • Floating Palette • Used to operate and modify front panel and block diagram objects. Automatic Selection Tool Scrolling Tool Breakpoint Tool Probe Tool Color Copy Tool Coloring Tool Operating Tool Positioning/Resizing Tool Labeling Tool Wiring Tool Shortcut Menu Tool
Status Toolbar Run Button Continuous Run Button Abort Execution Pause/Continue Button Text Settings Align Objects Distribute Objects Reorder Additional Buttons on the Diagram Toolbar Execution Highlighting Button Step Into Button Step Over Button Step Out Button
Open and Run a Virtual Instrument Signal Generation and Processing.vi
Creating a VI Front Panel Window Block Diagram Window Indicator Terminals Control Terminals
Wiring Tips – Block Diagram Wiring “Hot Spot” Click To Select Wires Spacebar Flips Wire Orientation Click While Wiring To Tack Wires Down
Dataflow Programming • Block diagram does NOT execute left to right • Node executes when data is available to ALL input terminals • Nodes supply data to all output terminals when done
Section II – SubVIs • What is a subVI? • Making an icon and connector for a subVI • Using a VI as a subVI
SubVIs • A SubVI is a VI that can be used within another VI • Advantages • Modular • Easier to debug • Don’t have to recreate code • Require less memory
Icon Terminals Connector Icon and Connector • An icon represents a VI in other block diagrams • A connector shows available terminals for data transfer
SubVIs SubVIs
Steps to Create a SubVI • Create the Icon • Create the Connector • Assign Terminals • Save the VI • Insert the VI into a Top Level VI
Create the Icon • Right-click on the icon in the diagram or front panel
Create the Connector Right click on the icon pane (front panel only)
Save The VI • Choose an Easy to Remember Location • Organize by Functionality • Save Similar VIs into one directory (e.g. Math Utilities) • Organize by Application • Save all VIs Used for a Specific Application into one directory or library file (e.g. Lab 1 – Frequency Response) • Library Files (.llbs) combine many VI’s into a single file, ideal for transferring entire applications across computers
Insert the SubVI into a Top Level VI • Accessing user-made subVIs • Functions >> Select a VI • Or • Drag icon onto target diagram
Tips for Working in LabVIEW • Keystroke Shortcuts • <Ctrl-H> – Activate/Deactivate Context Help Window • <Ctrl-B> – Remove Broken Wires From Block Diagram • <Ctrl-E> – Toggle Between Front Panel and Block Diagram • <Ctrl-Z> – Undo (Also in Edit Menu) • Tab Key – Toggle Through Tools on Toolbar • Tools » Options… – Set Preferences in LabVIEW • VI Properties – Configure VI Appearance, Documentation, etc.
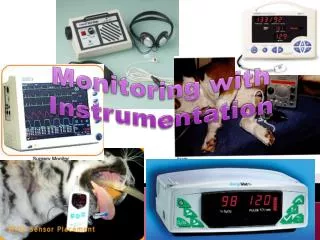
Sensors DAQ Device Computer Cable Terminal Block Section III – Data Acquisition • Data acquisition (DAQ) basics • Connecting Signals • Simple DAQ application
DAQ – Data Acquisition • Plug-in board for a computer with: • Analog input channels • Analog output channels • Counters • Digital I/O • Controlled by a suite of LabVIEW VIs Functions>>Data Acquisition
DAQ – Data Acquisition Simple Temperature Acquisition Example Two parameters • Device = 1 • Channel = 0
Data Acquisition Terminology • Resolution - Determines How Many Different Voltage Changes Can Be Measured • Larger Resolution More Precise Representation of Signal • Range - Minimum and Maximum Voltages • Smaller range More Precise Representation of Signal • Gain - Amplifies or Attenuates Signal for Best Fit in Range
Hardware Connections BNC-2120 SC-2075 SCB-68
Exercise 2 – Simple Data Acquisition Complete Convert C to F.vi, then create Thermometer.vi.
Section IV – Loops and Charts • For Loop • While Loop • Charts • Multiplots
Loops • While Loops • Have Iteration Terminal • Always Run Once • Run According to Continue Terminal • For Loops • Have Iteration Terminal • Run According to input N
Select the loop Enclose Code to Repeat Loops (cont.) For Loop
Charts Waveform chart – special numeric indicator that can display a history of values Controls >> Graphs >> Waveform Chart
Single Plot Charts Multiplot Charts Wiring Data into Charts
Exercise 3 Students build Temperature Monitor.vi.
Section V – Arrays & File I/O • Build arrays manually • Have LabVIEW build arrays automatically • Write to a spreadsheet file • Read from a spreadsheet file
Adding an Array to the Front Panel From the Controls >> Array and Cluster subpalette, select the Array Shell Drop it on the screen.
Adding an Array (cont.) Place data object into shell (e.g. digital control).
Creating an Array with a Loop • Loops accumulate arrays at their boundaries
File I/O File I/O – passing data to and from files - Files can be binary, text, or spreadsheet Write to a spreadsheet file Read from a spreadsheet file
File I/O Easy File I/O VIs • Read/write to spreadsheet file • Read/write characters to file (ASCII) • Read lines from file • Read/write binary file
File I/O Example Writing a 2D Array to File
File I/O Example Reading a 2D Array from a File
Exercise 4 – Analyzing and Logging Data Students build Temperature Logger.vi
Where Do I Go From Here? • Example programs (Help» Find Examples…) • LabVIEW Student Edition (www.ni.com/labviewse) • Web resources (ni.com) • NI Developer Zone (zone.ni.com) • Application Notes • Info-labview newsgroup (www.info-labview.org/) • Instrument Driver Library (www.ni.com/idnet)