Download
1 / 9
160 likes | 344 Views
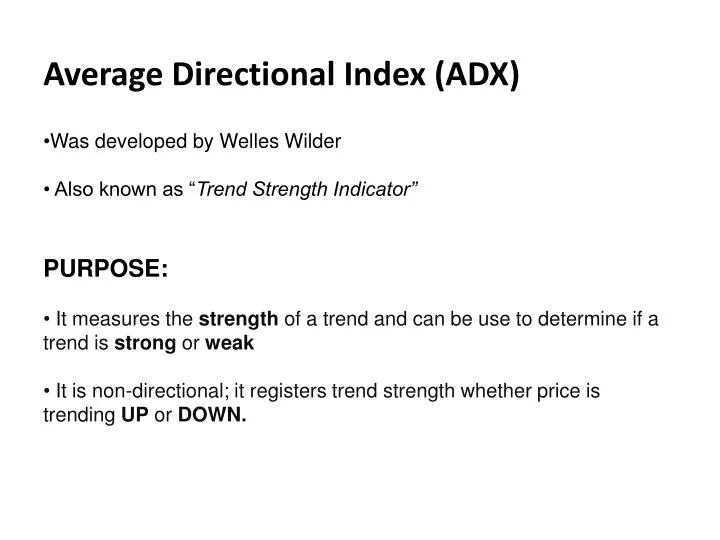
Average Directional Index (ADX) Was developed by Welles Wilder Also known as “ Trend Strength Indicator” PURPOSE: It m easures the strength of a trend and can be use to determine if a trend is strong or weak

E N D
Average Directional Index (ADX) • Was developed by Welles Wilder • Also known as “Trend Strength Indicator” • PURPOSE: • It measures the strength of a trend and can be use to determine if a trend is strong or weak • It is non-directional; it registers trend strength whether price is trending UP or DOWN.
CALCULATIONS: • THE HIGHER THE NUMBER, THE STRONGER THE TREND • The following below indicates the strength of the trend in correspondence to the ADX value. • ADX Value Trend Strength • 0-25 Absent or Weak Trend • 25-50 Strong Trend • 50-75 Very Strong Trend • 75-100 Extremely Strong Trend
When ADX is below 25, the trend is weak. When ADX is above 25 and rising, the trend is strong. When ADX is above 25 and falling, the trend is less strong.
Two Indicators: • +DI positive directional indicator • represents how strong or weak the UPTREND or the BUYERS in the market • -DI negative directional indicator • represents how strong or weak the DOWNTREND or the SELLERS in the market
If ADX (7) >= 60, then ENTER the market and SELL at previous low. A trend reversal will likely to occur. • ADX (7) = 61.46
If the +DI line is above the –DI line, then the trend is considered bullish; prices are moving up, ADX measures strength of UPTREND • If the –DI crosses above the +DI, then the trend is considered bearish; prices are going down, ADX measures strength of DOWNTREND • -Crosses of the +DI and -DI lines generate buy and sell signals. • If +DI crosses above –DI, then a buy signal is generated. • If +DI crosses below –DI, then a sell signal is generated. • A move below (20) from above indicates that the trend is slowing. Therefore an ADX move below (20) would indicate that it is time to close positions. • Conversely, an ADX indicator move above (20) from below indicates that the sideways trading is over, and a new trend is developing. This would indicate that it is time to make a move, either bullish or bearish.