Download
1 / 77
770 likes | 781 Views
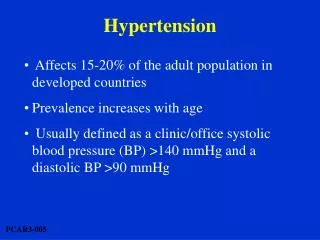
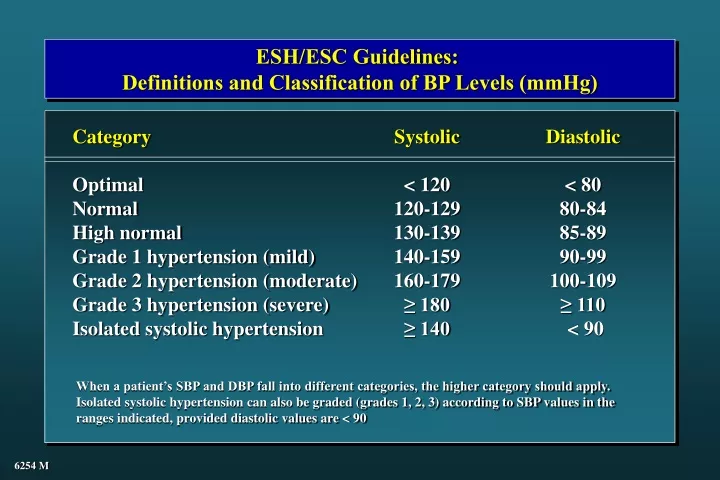
ESH/ESC Guidelines: Definitions and Classification of BP Levels (mmHg). Category Optimal Normal High normal Grade 1 hypertension (mild) Grade 2 hypertension (moderate) Grade 3 hypertension (severe) Isolated systolic hypertension. Systolic < 120 120-129 130-139 140-159 160-179

E N D
ESH/ESC Guidelines: Definitions and Classification of BP Levels (mmHg) Category Optimal Normal High normal Grade 1 hypertension (mild) Grade 2 hypertension (moderate) Grade 3 hypertension (severe) Isolated systolic hypertension Systolic < 120 120-129 130-139 140-159 160-179 ≥ 180 ≥ 140 Diastolic < 80 80-84 85-89 90-99 100-109 ≥ 110 < 90 When a patient’s SBP and DBP fall into different categories, the higher category should apply. Isolated systolic hypertension can also be graded (grades 1, 2, 3) according to SBP values in the ranges indicated, provided diastolic values are < 90 6254 M
Stroke and usual BP (in 5 categories defined by baseline DBP) 7 prospective observational studies: 843 events CHD and usual BP (in 5 categories defined by baseline DBP) 9 prospective observational studies: 4856 events Relative Risk of Stroke Relative Risk of Stroke Baseline DBP category Usual SBP Usual DBP Baseline DBP category Usual SBP Usual DBP 1 2 3 4 5 1 2 3 4 5 123 76 136 84 148 91 162 99 175 105 123 76 136 84 148 91 162 99 175 105 Approximate mean usual BP (estimated from later remeasurements in the Framingham Study) Approximate mean usual BP (estimated from later remeasurements in the Framingham Study) Collins R and McMahon S, British Medical Bulletin 1994 3510
JNC 7 Individuals with SBP of 120-139 or DBP of 80-89 mmHg should be considered as prehypertensive and require health promoting lifestyle modifications to prevent CVD
4-Year Frequency (%) of Progression to HT according to BP Values within Normal Range * (n = 9845, Framingham) 35-64 ys 65-94 ys 49.5 37.3 25.5 17.6 16.0 5.3 * Data adjusted for sex, age, BMI, baseline examinations Vasan et al., Lancet 2001; 358: 1682 7395 M
“Prehypertension” - Criticism Progression to HT less frequent in several studies “Hypertension” has an ominous significance by the layman Anxiety over the term may create need for medical visits / lab examinations Several lifestyle changes must be preceded by / performed under medical check / guidance Lifestyle changes - Not invariably devoid of cost - Reflection on subject’s QoL, freedom etc. 8222 M
ESH/ESC Guidelines: Stratification of Risk to Quantify Prognosis Blood Pressure (mmHg) Normal SBP 120-129 or DBP 80-84 High Normal SBP 130-139 or DBP 85-89 Grade 1 SBP 140-159 or DBP 90-99 Grade 2 SBP 160-179 or DBP 100-109 Grade 3 SBP ≥ 180 or DBP ≥ 110 Other Risk Factors and Disease History No other risk factors 1-2 risk factors Associated Clinical Conditions Average risk Average risk Low added risk Moderate added risk High added risk Low added risk Low added risk Moderate added risk Moderate added risk Very high added risk Moderate added risk High added risk High added risk High added risk Very high added risk 3 or more risk factors or TOD or diabetes Very high added risk Very high added risk High added risk Very high added risk Very high added risk Low risk: < 15%; Medium risk: 15-20%; High risk: 20-30%; Very high risk: > 30% 7772 M
ESH/ESC Guidelines: Factors Influencing Prognosis Risk factors for CV disease used for stratification Levels of SBP and DBP Men > 55 years Women > 65 years Smoking Dyslipidaemia (total chol. > 250 mg/dl, or LDL-chol. > 155 mg/dl, or HDL-chol. M < 40, W < 48 mg/dl Family history of premature CV disease (at age < 55 years M, < 65 years W) Abdominal obesity (abdominal circumference > 102 cm, W > 88 cm) C-reactive protein > 1 mg/dl Target Organ Damage (TOD) Left ventricular hypertrophy (electrocardiogram: Sokolow-Lyons > 38 mm; Cornell > 2440 mm*ms; echocardiogram: LVMI > 125, W > 110 g/m2) Ultrasound evidence of arterial wall thickening (carotid IMT > 0.9 mm) or atherosclerotic plaque Slight increase in serum creatinine (M 115-133, W 107-124 mol/l; M 1.3-1.5, W 1.2-1.4 mg/dl) Microalbuminuria (30-300 mg/24h; albumin-creatinine ratio M > 22, W > 31 mg/g; M > 2.5, W > 3.5 mg/mmol) Diabetes Mellitus Fasting plasma glucose 7.0 mmol/l (126 mg/dl) Postprandial plasma glucose > 1.0 mmol/l (198 mg/dl) Associated Clinical Conditions (ACC) Cerebrovascular disease: ischaemic stroke; cerebral haemorrhage; transient ischaemic attack Heart disease: myocardial infarction; angina; coronary revascularization; congestive heart failure Renal disease: diabetic nephropathy; renal impairment (serum creatinine M > 1.5, W > 1.4 mg/dl) proteinuria (> 300 mg/24h) Peripheral vascular disease Advanced retinopathy: haemorrhages or exudates, papilloedema 6250 M
Stroke recurrency CVD 159 160 0 149 140 -10 120 -20 100 94 -30 90 80 -29 -32 60 -40 Stroke recurrency CVD 160 0 136 140 -10 127 120 -20 100 -24 -30 80 -29 79 75 60 -40 HT BP (mmHg) RRR (%) NT BP (mmHg) RRR (%) PROGRESS, Lancet 2001 8236 M
Stroke More vs less CHD More vs less Heart failure More vs less Major CV events More vs less CV death More vs less Total mortality More vs less Mean BP (mmHg) -4 / -3 -4 / -3 -4 / -3 -4 / -3 -4 / -3 -4 / -3 Favours active Favours control Relative Risk (95% CI) 0.77 (0.63-0.95) 0.86 (0.72-1.03) 0.84 (0.59-1.18) 0.86 (0.77-0.96) 0.93 (0.77-1.11) 0.96 (0.84-1.09) 0.5 1.0 2.0 Relative risk 8175 = 6397 alt. M
RR of CVD with Low-Dose Aspirin (vs Placebo) in HOT On-treatment BP (mmHg) Medium risk High / very high risk ~ 140/83 1.00 0.78 * * statistically significant Zanchetti et al., J Hypertens 2002; 20: 2309 8247 M
On-Treatment BP and Events with Atorvastatin (vs Placebo) in ASCOT All patients with ≥ 3 risk factors BP (mmHg) ~ 138/80 Stroke -27% CHD -29% CVD -21% Total mortality -13% (NS) 8248 M
Initiation of Antihypertensive Treatment Blood Pressure (mmHg) Normal SBP 120-129 or DBP 80-84 High Normal SBP 130-139 or DBP 85-89 Grade 1 SBP 140-159 or DBP 90-99 Grade 2 SBP 160-179 or DBP 100-109 Grade 3 SBP ≥ 180 or DBP ≥ 110 Other Risk Factors and Disease History No other risk factors 1-2 risk factors 3 or more risk factors or TOD or diabetes Associated clinical conditions No BP intervention No BP intervention Lifestyle changes for several months Then drug treatment if preferred by the patient and resources available Lifestyle changes for several months Then drug treatment Immediate drug treatment and lifestyle changes Lifestyle changes Lifestyle changes Lifestyle changes for several months Then drug treatment Lifestyle changes for several months Then drug treatment Immediate drug treatment and lifestyle changes Lifestyle changes Drug treatment and lifestyle changes Drug treatment and lifestyle changes Drug treatment and lifestyle changes Immediate drug treatment and lifestyle changes Drug treatment and lifestyle changes Immediate drug treatment and lifestyle changes Immediate drug treatment and lifestyle changes Immediate drug treatment and lifestyle changes Immediate drug treatment and lifestyle changes
Association of Hypertension with Other CAD Risk Factors: Framingham Study One 26% One 27% Two 25% Two 24% None 19% None 17% Three 22% Three 20% Four or more 8% Four or more 12% Men Women Kannel, Am J Hypertens 2000; 13: 3S-10S 2313
Echocardiography and US TSA in Low Risk HypertensivesAPROS STUDY RISK RE-CLASSIFICATION Cuspidi et al, J Hypertens 2002
Smoking BMI Ch TG 60 60.3 57.7 53.4 % 48.4 48.9 43.7 40 33.1 30.1 26.1 25.4 24.5 20 22.2 14.3 12.2 12.0 8.0 0 * * * 15 HDL-Ch UA DM % 13.1 Optimal BP 12.1 10 Normal BP High normal BP Untreated HT 6.3 6.3 6.1 5 6.0 5.3 5.1 5.2 5.2 * P < 0.0001 P < 0.0002 3.8 2.4 0 NS * * Risk Factors in Subjects of the SMOOTH Study with BP from Optimal to Untreated HT 7637 M
JNC VII: Classification and Management of Blood Pressure for Adults Agfed 18 years and Older Initial drug therapy BP classification SBP* mmHg DBP* mmHg Lifestyle modification Without compelling indication With compelling indications Normal <120 and <80 Encourage Prehypertension 120–139 or 80–89 Yes No antihypertensive drug indicated. Drug(s) for compelling indications. ‡ Stage 1 Hypertension 140–159 or 90–99 Yes Thiazide-type diuretics for most. May consider ACEI, ARB, BB, CCB, or combination. Drug(s) for the compelling indications.‡ Other antihypertensive drugs (diuretics, ACEI, ARB, BB, CCB) as needed. Stage 2 Hypertension >160 or >100 Yes Two-drug combination for most† (usually thiazide-type diuretic and ACEI or ARB or BB or CCB). *Treatment determined by highest BP category. †Initial combined therapy should be used cautiously in those at risk for orthostatic hypotension. ‡Treat patients with chronic kidney disease or diabetes to BP goal of <130/80 mmHg. 6273 M
Clinical Outcomes (6 yr rate .100 persons) in ALLHAT CHD Stroke CHF ESRF C 11.5 5.6 7.7 1.8 A 11.3 5.4 10.2** 2.1 L 11.4 6.3* 8.7** 2.0 * P < 0.02 ** P < 0.01 4673 M
Trials on “New” vs “Old” TreatmentsPrimary Endpoints (RR + 95% CI) CAPPP* STOP2* ANBP2* ALLHAT° STOP2* NORDIL* INSIGHT* ALLHAT° INVEST* ALLHAT° SCOPE* LIFE* ACE-I ACE-I ACE-I ACE-I CCB CCB CCB CCB CCB B ARB ARB 1.05 (0.90-1.22) 1.01 (0.84-1.22) 0.89 (0.79-1.00) 0.99 (0.91-1.08) 0.97 (0.80-1.17) 1.00 (0.87-1.15) 1.10 (0.91-1.34) 0.98 (0.90-1.07) 0.98 (0.90-1.06) 1.03 (0.90-1.17) 0.89 (0.75-1.06) 0.87 (0.77-0.98) n = 10985 n = 4418 n = 6083 n = 9054 n = 4209 n = 10881 n = 6321 n = 9048 n = 22599 n = 24335 n = 4506 n = 9193 0.5 1.0 2.0 * CVD; ° CHD New better Old better Mancia G. et al., 2003 5487 M
ANBP2: Primary End-Points among All, Male, and Female Subjects All Subjects End Point All CV events or death from any cause First CV event or death from any cause Death from any cause Male Subjects End Point All CV events or death from any cause First CV event or death from any cause Death from any cause Female Subjects End Point All CV events or death from any cause First CV event or death from any cause Death from any cause Hazard Ratio (95% CI) 0.89 (0.79-1.00) 0.89 (0.79-1.01) 0.90 (0.75-1.09) Hazard Ratio (95% CI) 0.83 (0.71-0.97) 0.83 (0.71-0.97) 0.83 (0.66-1.06) Hazard Ratio (95% CI) 1.00 (0.83-1.21) 1.00 (0.83-1.20) 1.01 (0.76-1.35) P Value 0.05 0.06 0.27 P Value 0.02 0.02 0.14 P Value 0.98 0.98 0.94 ACE-I superior Diuretics superior 0.2 1.0 5.0 ACE-I superior Diuretics superior 0.2 1.0 5.0 ACE-I superior Diuretics superior 0.2 1.0 5.0 Wing et al., N Engl J Med 2003; 348: 583-92 5370 M
All Cardiovascular Events Number of events / patients Trials MIDAS/NICS/VHAS STOP2/CCBs NORDIL INSIGHT ALLHAT/Aml ELSA CCBs without CONVINCE Het. p = 0.78 CONVINCE All CCBs Het. p = 0.86 UKPDS STOP/ACEIs CAPPP ALLHAT/Lis ANBP2 All ACEIs Het. p = 0.006 LIFE SCOPE All ARBs Het. p = 0.69 ALLHAT/Dox All Trials Het. p < 0.0001 Old 37/ 1358 637/ 2213 453/ 5471 397/ 3164 3941/15255 33/ 1157 5498/28618 365/ 8297 5863/36915 78/ 358 637/ 2213 401/ 5493 3941/15255 429/ 3039 5486/26358 588/ 4588 268/ 2460 856/ 7048 2245/15268 7627/53279 New 39/ 1353 636/ 2196 466/ 5410 383/ 3157 2432/ 9048 27/ 1177 3983/22341 364/ 8179 4347/30520 107/ 400 586/ 2205 438/ 5492 2514/ 9054 394/ 3044 4039/20195 508/ 4605 242/ 2477 750/ 7082 1592/ 9067 10728/67295 Difference (SD) 3.6% (2.4) 2p = 0.14 3.4% (2.3) 2p = 0.15 2.6% (3.6) 2p = 0.59 -14.3% (5.5) 2p = 0.004 1.4% (4.8) 2p = 0.69 Odds ratios (95% CIs) . . 0 1 2 3 New drugs better Old drugs better Staessen, J Hypertens 2003 5563 M
CVD and HTN • Antihypertensive T reduces CVD • Benefit with a variety of drug classes • D • BB • ACEI • CA • ARB • BP reduction per se major factor 4662 M
1.50 1.50 1.50 Stroke Major CVD CHD 1.25 1.25 1.25 1.00 1.00 1.00 0.75 0.75 0.75 0.50 0.50 0.50 0.25 0.25 0.25 -10 -8 -6 -4 -2 0 2 4 -10 -8 -6 -4 -2 0 2 4 -10 -8 -6 -4 -2 0 2 4 1.50 1.50 CVD death Total mortality 1.25 1.25 1.00 1.00 0.75 0.75 0.50 0.50 0.25 0.25 -10 -8 -6 -4 -2 0 2 4 -10 -8 -6 -4 -2 0 2 4 Relative risk of outcome event SBP difference between randomized groups (mmHg) 7939 = 6398 M mod.
40 30 20 10 0 Risk of CVD according to SBP Control by Treatment CHF Prior MI Diabetes Prior Stroke / TIA Renal Impairment Age No Yes No Yes No Yes No Yes No Yes ≤ 70 > 70 † 30.2 * 29.8 24.6 24.1 * 21.0 20.3 18.9 18.7 17.4 † * 14.8 * 14.0 13.6 13.5 12.4 12.4 11.9 11.9 10.8 7.9 7.4 7.4 6.7 6.4 5.1 ≥ 140 mmHg * P < 0.001; P = 0.03; † P = 0.04 < 140 mmHg Pepine, Koney, Kupfer, Benetos, Mancia et al., 2004 8273 M
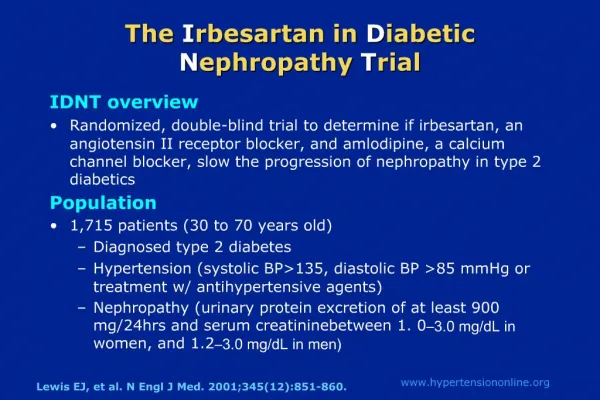
UKPDS (<85 mm Hg, diastolic) MDRD (92 mm Hg, MAP) HOT (<80 mm Hg, diastolic) AASK (<92 mm Hg, MAP) RENAAL (<140/90 mm Hg) IDNT (135/85 mm Hg) 1 2 3 4 Number of BP Medications Hypertension in High-Risk Patients: Number of Agents Required to Achieve BP Goal UKPDS=United Kingdom Prospective Diabetes Study; MDRD=Modification of Diet in Renal Disease; HOT=Hypertension Optimal Treatment; AASK=African American Study of Kidney Disease; RENAAL=Reduction of Endpoints in NIDDM with the Angiotensin II Antagonist Losartan; IDNT=Irbesartan Diabetic Nephropathy Trial; MAP=mean arterial pressure. Bakris et al. Am J Kidney Dis. 2000;36:646-661; Brenner et al. N Engl J Med. 2001;345:861-869; Lewis et al. N Engl J Med. 2001;345:851-860 5129 M
2003 ESH/ESC Guidelines Diuretics AT1-receptor blockers ß-blockers Calcium antagonists 1-blockers ACE inhibitors 6220 M
2003 ESH/ESC Guidelines Consider: Untreated BP level Absence or presence of TOD and risk factors Choose between If goal BP not achieved If goal BP not achieved Single agent at low dose Two-drug combination at low dose Two-three drug combination at effective doses Previous agent at full dose Switch to different agent at low dose Previous combination at full dose Add a third drug at low dose Two-three drug combination Full dose monotherapy 6219 M
ESH/ESC Guidelines Particular attention should be given to adverse events, even primarily subjective disturbances, because they may be an important cause of non-compliance Pts should always be asked about adverse effects and doses or drugs changed accordingly 6375 M
ESH/ESC Guidelines - Specific Indications for Drug Classes Thiazides Loop diuretics Antialdosterone D B CCB (DHP) CCB (non-DHP) ACEI ARB B CHF / Elderly / ISH / Blacks Renal insufficiency / CHF CHF / Post-MI Angina / Post-MI / CHF / Pregnancy / Tachyarrhythmias Elderly / ISH / Angina / PVD / Ca atherosclerosis / Pregnancy Angina / Ca atherosclerosis / Suprav. tachycardia CHF / LV dysfunction / Post-MI / Non-DN / Type I DN / Proteinuria Type 2 DN / Diabetic microalbuminuria / Proteinuria / LVH / ACEI-cough BPH / Hyperlipidaemia 6372 M
1993 ESH/ESC Guidelines: Antihypertensive Treatment in DM Non-pharmacological measures (particularly weight loss and Na intake) in all patients BP goal a 130/80 mmHg Combination T required most often Use of all effective / well tolerated agents recommended Renoprotection benefits from regular inclusion in combination T of - ACEI in type I DM - ARB in type II DM In type II DM with normal BP use first a RAS blocker Microalbuminuria (type I/II DM) is an indication for T, especially with RAS blocker, irrespective of BP values 6262 M
Risk Factors Subclinical Organ Damage Events Not surrogate but “intermediate” end-point 7997 M
LVH Regression by Different Classes of Antihypertensive Drugs Calcium antagonists Ag II- Blockers Diuretics -Blockers ACE-I Reduction of LVM (%) p < 0.01 p < 0.01 p < 0.05 Klingbeil A, Schmieder RE, Curr Cardiol Report 2003 6362 M
HOPE:Reduction in Primary Outcome with Regression/Prevention of LVH 0.20 Proportion of all patients with primary outcome (CV death, MI, stroke) P = 0.0061 0.15 Development / Persistence 0.10 0.05 Regression / Prevention 0.00 0 500 1000 1500 2000 Days of follow-up * whether or not hospitalized Mathew J et al., Circulation 2001; 104: 1615-1621 5811 M
0 -10 -20 -30 -40 -50 New DM in Antihypertensive Drugs Trials CAPPP ACEI vs Conv STOP-2 ACEI vs Conv ALLHAT ACEI vs D HOPE ACEI vs PL STOP-2 CA vs Conv INVEST CA vs Conv STOP-2 ACEI vs CA LIFE ARB vs BB SCOPE ARB vs Conv CHARM ARB vs PL INSIGHT CA vs D ALLHAT CA vs D -2 -2 -4 -16** -14 -16 -20 -21 -23 -25 -30** -25* -34 -40* * T, 2 yrs; ** T, 4 yrs 8092 M = 4850 new
Rate of Metabolic Syndrome and New Onset Diabetes in ALPINE after 1 Year T Candesartan HCTZ B 13 (6.6%) 12 (6.1%) Metabolic Syndrome T 5 (2.6%) 18 (9.2%) Diabetes 1 (0.5%) 8 (4.1%) Lindholm et al., J Hypertens 2003; 21: 1563 8270 M
Importance (Hazard Ratio) of Blood Glucose at Age 50 to 60 on Risk of MI after 60 Antihypertensive T (mainly D/BB) Yes (n = 291) 1.37* 1.04 0.88 0.11 0.96 0.99 0.85 0.92 No (n = 1358) 1.14 1.16 0.98 1.19° 1.25 1.27† 1.01 1.26 ° Glucose Glucose BMI BMI SBP SBP DBP DBP * P = 0.0004; ° P = 0.02; † P = 0.01 Dunder et al., BMJ 2003, 326 6232 M
JNC 7 - Stage I Hypertension As it is Improved Further improvement Ideal Thiazide diuretics for most May consider ACEI / ARB / CCB or combination Thiazide diuretics For most may consider ACEI / ARB / CCB or combination Thiazide diuretics For most may consider ACEI / ARB / CCB / BB or, more frequently, combination T ESH/ESC Guidelines 6701 M
Percent of Italian Hypertensives with BP Control (<140/90 mmHg) after Year 2000 Forlife (n = 12792) SMOOTH (n = 2144 *) Mancia et al. J Hypertension 2004, 2 (n = 3812) 12.2 21.7 14.0 Practitioners Practitioners Specialists Hypertensives enrolled by physicians across Italian territory * Population survey in San Marino - n refers to hypertensive fraction 8234 M
* p < 0.05 vs control Effects of antihypertensive agents on changes in proteinuria and albuminuria in patients with type 1 and 2 diabetes mellitus (meta-regression analysis, 100 studies, 2494 patients) Proteinuria 0.2 Albuminuria * * -0.0 Log change from baseline -0.2 -0.4 ACE Inhibitors Calcium Channel Blockers b-blockers Control -0.6 Kasiske et al Ann Intern Med 1993 5993 M
CBMmax: Final Scan versus Baseline Scan 0.06 Atenolol Mean Change (mm) Lacidipine 0.05 0.04 0.03 0.02 0.01 0 ITT PP 1 PP 2 Compl. Ratios of Mean Changes and 95% CI ITT PP 1 PP 2 Compl. 0.2 0.4 0.6 0.8 1 1.2 1.4 Lacidipine better Atenolol better 8290 M
ESH/ESC vs JNC 7 - Major Agreements Benefits of antihypertensive T Avoidance of complex lab examinations BP measurement procedure Use / value of ABPM / home BP Use of antiplatelet / lipid lowering drugs BP targets (and thresholds?) Follow-up strategies Value of fixed / long-acting / low dose combinations Compelling drug indications ( more of format than of substance) Combination T (as above) Treatment of most specific conditions 6705 M
Progression of non-diabetic renal disease A meta-analysis of data on 1860 pts on antihypertensive regimens Including ACE-inhibitors Not including ACE-inhibitors Blood Pressure Urinary protein excretion 150 2.0 Systolic BP(mmHg) 1.8 140 1.6 139/85 vs 144/87 p<0.001 130 95 Urinary protein excretion g/d 1.4 90 Diastolic BP(mmHg) 1.2 85 p<0.001 80 1.0 Doubling of baseline serum creatinineconcentration or ESD Survival without end-stage renal disease 1.0 1.0 0.8 0.8 Survival without doubling of baseline serum Creatinine concentration of ESRD 0.6 0.6 Survival without ESRD 0.4 0.4 0.2 0.2 p<0.003 p<0.001 0.0 0.0 0 12 24 36 48 0 12 24 36 48 Follow-up (mo) Follow-up (mo) Patient, n Control 919 752 632 404 63 ACEI 941 770 657 450 56 Jafar TH, Ann Int Med 2001;135:73-87.
Results of IDNT: Primary Objective Blood Pressure Irbesartan 140/77 Amlodipine 141/77 Placebo 144/80 RR 0.77 1.07 0.71 p-value 0.011 ns 0.001 irbesartan vs placebo amlodipine vs placebo irbesartan vs amlodipine ASH 2001 2283
Effect of Antihypertensive Treatment (n = 10) MAP (mmHg) Start of treatment GFR (ml/min/1.73 m2) Albuminuria (g/min) Parving et al., Lancet 1983 4826 M
Stroke ACEI vs D/BB CA vs D/BB ACEI vs CA CHD ACEI vs D/BB CA vs D/BB ACEI vs CA Heart failure ACEI vs D/BB CA vs D/BB ACEI vs CA Major CV events ACEI vs D/BB CA vs D/BB ACEI vs CA CV death ACEI vs D/BB CA vs D/BB ACEI vs CA Total mortality ACEI vs D/BB CA vs D/BB ACEI vs CA Mean BP (mmHg) +2 / 0 0 / 0 +1 / +1 +2 / 0 0 / 0 +1 / +1 +2 / 0 0 / 0 +1 / +1 +2 / 0 0 / 0 +1 / +1 +2 / 0 0 / 0 +1 / +1 +2 / 0 0 / 0 +1 / +1 Favours first listed Favours second listed Relative Risk (95% CI) 1.09 (1.00-1.18) 0.93 (0.86-1.01) 1.12 (1.01-1.25) 0.98 (0.91-1.05) 1.01 (0.94-1.08) 0.96 (0.88-1.05) 1.07 (0.96-1.19) 1.34 (1.22-1.47) 0.82 (0.73-0.92) 1.02 (0.98-1.07) 1.04 (0.99-1.08) 0.97 (0.92-1.03) 1.03 (0.95-1.11) 1.04 (0.97-1.12) 1.03 (0.94-1.13) 1.00 (0.95-1.05) 0.99 (0.94-1.04) 1.04 (0.98-1.10) 0.5 1.0 2.0 Relative risk 6396 M
Intermediate Outcomes: Biochemical Changes at 4 years Potassium - mmol/L Chlorthalidone 4.1 Amlodipine 4.4 P<.001 Lisinopril 4.5 P<.001 % < 3.5mmol/L Chlorthalidone 8.5 Amlodipine 1.9 P<.001 Lisinopril 0.8 P<.001 5209 M
ALLHAT - K+ Supplementation Analysis C 8% A 4% L 2% 8081 M
Diuretic-Induced Hypokalemia Common More lab examinations? Sudden death? Protection by antihypertensive treatment? 8097 M
Hazard Ratio of CVD According to Serum K+ of Treated Patients at 1 Year in SHEP 1.18 (0.73-1.76) K+ < 3.5 mEq/l K+ ≥ 3.5 mEq/l CVD CHD Stroke 0.61 (0.50-0.75) 1.46 (0.79-2.67) 0.75 (0.56-1.01) 1.43 (0.74-2.74) 0.51 (0.36-0,71) 0.1 0.5 1 2 5 10 Treatment better Placebo better 4851