Download
1 / 1
10 likes | 109 Views
Vertical Stratification of the Water Column: A Look at the Coastal Ocean and the Laboratory Rachel A. Koehler 1 , John A. Quinlan 2 , C. Grant Law 2 , John P. Manderson 3

E N D
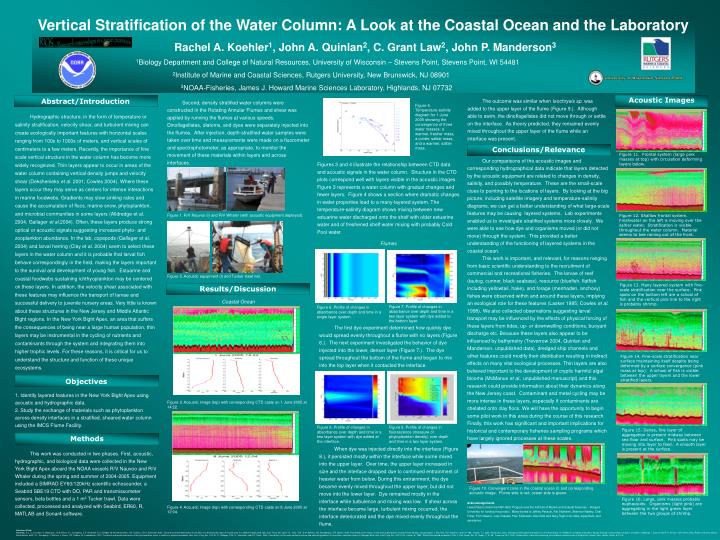
Vertical Stratification of the Water Column: A Look at the Coastal Ocean and the Laboratory Rachel A. Koehler1, John A. Quinlan2, C. Grant Law2, John P. Manderson3 1Biology Department and College of Natural Resources, University of Wisconsin – Stevens Point, Stevens Point, WI 54481 rkoeh231@uwsp.edu 2Institute of Marine and Coastal Sciences, Rutgers University, New Brunswick, NJ 08901 quinlan|law@marine.rutgers.edu 3NOAA-Fisheries, James J. Howard Marine Sciences Laboratory, Highlands, NJ 07732 John.Manderson@noaa.gov Second, density stratified water columns were constructed in the Rotating Annular Flumes and shear was applied by running the flumes at various speeds. Dinoflagellates, diatoms, and dyes were separately injected into the flumes. After injection, depth-stratified water samples were taken over time and measurements were made on a fluorometer and spectrophotometer, as appropriate, to monitor the movement of these materials within layers and across interfaces. Figure 1. R/V Nauvoo (l) and R/V Whaler (with acoustic equipment deployed). Figure 2. Acoustic equipment (l) and Tucker trawl net. Coastal Ocean Figure 3. Acoustic image (top) with corresponding CTD casts on 1 June 2005 at 14:22. Figure 4. Acoustic image (top) with corresponding CTD casts on 8 June 2005 at 12:04. Our comparisons of the acoustic images and corresponding hydrographical data indicate that layers detected by the acoustic equipment are related to changes in density, salinity, and possibly temperature. These are the small-scale clues to pointing to the locations of layers. By looking at the big picture, including satellite imagery and temperature-salinity diagrams, we can get a better understanding of what large-scale features may be causing layered systems. Lab experiments enabled us to investigate stratified systems more closely. We were able to see how dye and organisms moved (or did not move) through the system. This provided a better understanding of the functioning of layered systems in the coastal ocean. This work is important, and relevant, for reasons ranging from basic scientific understanding to the recruitment of commercial and recreational fisheries. The larvae of reef (tautog, cunner, black seabass), resource (bluefish, flatfish including yellowtail, hake), and forage (menhaden, anchovy) fishes were observed within and around these layers, implying an ecological role for these features (Lasker 1985; Cowles et al. 1998). We also collected observations suggesting larval transport may be influenced by the effects of physical forcing of these layers from tides, up- or downwelling conditions, buoyant discharge etc. Because these layers also appear to be influenced by bathymetry (Treverrow 2004, Quinlan and Manderson, unpublished data), dredged ship channels and other features could modify their distribution resulting in indirect effects on many vital ecological processes. Thin layers are also believed important to the development of cryptic harmful algal blooms (McManus et al., unpublished manuscript) and this research could provide information about their dynamics along the New Jersey coast. Contaminant and metal cycling may be more intense in these layers, especially if contaminants are chelated onto clay flocs. We will have the opportunity to begin some pilot work in this area during the course of this research. Finally, this work has significant and important implications for historical and contemporary fisheries sampling programs which have largely ignored processes at these scales. Acknowledgements I would like to thank the NSF-REU Program and the Institute of Marine and Coastal Sciences – Rutgers University for funding this project. Many thanks to Jeffrey Pessutti, Pat Shaheen, Shannon Newby, Char Fuller, Piotr Nawrot, Judy Grassle, Paul Falkowski, Alex Kahl and Gary Taghon for data, equipment, and assistance. Hydrographic structure, in the form of temperature or salinity stratification, velocity shear, and turbulent mixing can create ecologically important features with horizontal scales ranging from 100s to 1000s of meters, and vertical scales of centimeters to a few meters. Recently, the importance of fine scale vertical structure in the water column has become more widely recognized. Thin layers appear to occur in areas of the water column containing vertical density jumps and velocity shear (Dekshenieks et al. 2001; Cowles 2004). Where these layers occur they may serve as centers for intense interactions in marine foodwebs. Gradients may slow sinking rates and cause the accumulation of flocs, marine snow, phytoplankton, and microbial communities in some layers (Alldredge et al. 2004, Gallager et al.2004). Often, these layers produce strong optical or acoustic signals suggesting increased phyto- and zooplankton abundance. In the lab, copepods (Gallager et al. 2004) and larval herring (Clay et al. 2004) seem to select these layers in the water column and it is probable that larval fish behave correspondingly in the field, making the layers important to the survival and development of young fish. Estuarine and coastal foodwebs sustaining ichthyoplankton may be centered on these layers. In addition, the velocity shear associated with these features may influence the transport of larvae and successful delivery to juvenile nursery areas. Very little is known about these structures in the New Jersey and Middle Atlantic Bight regions. In the New York Bight Apex, an area that suffers the consequences of being near a large human population, thin layers may be instrumental in the cycling of nutrients and contaminants through the system and integrating them into higher trophic levels. For these reasons, it is critical for us to understand the structure and function of these unique ecosystems. 1. Identify layered features in the New York Bight Apex using acoustic and hydrographic data. 2. Study the exchange of materials such as phytoplankton across density interfaces in a stratified, sheared water column using the IMCS Flume Facility. This work was conducted in two phases. First, acoustic, hydrographic, and biological data were collected in the New York Bight Apex aboard the NOAA vessels R/V Nauvoo and R/V Whaler during the spring and summer of 2004-2005. Equipment included a SIMRAD EY60/120kHz scientific echosounder, a Seabird SBE19 CTD with DO, PAR and transmissometer sensors, beta bottles and a 1 m2 Tucker trawl. Data were collected, processed and analyzed with Seabird, ER60, R, MATLAB and Sonar4 software. Figures 3 and 4 illustrate the relationship between CTD data and acoustic signals in the water column. Structure in the CTD plots correspond well with layers visible in the acoustic images. Figure 3 represents a water column with gradual changes and fewer layers. Figure 4 shows a section where dramatic changes in water properties lead to a many-layered system. The temperature-salinity diagram shows mixing between new estuarine water discharged onto the shelf with older estuarine water and of freshened shelf water mixing with probably Cold Pool water. Flumes Acoustic Images Abstract/Introduction The outcome was similar when Isochrysis sp. was added to the upper layer of the flume (Figure 9.). Although able to swim, the dinoflagellates did not move through or settle on the interface. As theory predicted, they remained evenly mixed throughout the upper layer of the flume while an interface was present. Figure 5. Temperature-salinity diagram for 1 June 2005 showing the convergence of three water masses: a warmer, fresher mass, a colder, saltier mass, and a warmer, saltier mass. Conclusions/Relevance Figure 11. Frontal system (large pink masses at top) with circulation deforming layers below. Figure 12. Shallow frontal system. Freshwater on the left is moving over the saltier water. Stratification is visible throughout the water column. Material seems to bee raining out of the front. Figure 13. Many layered system with fine-scale stratification near the surface. Pink spots on the bottom left are a school of fish and the vertical pink line to the right is probably shrimp. Results/Discussion Figure 7. Profile of changes in absorbance over depth and time in a two layer system with dye added to the bottom layer. Figure 6. Profile of changes in absorbance over depth and time in a single layer system. The first dye experiment determined how quickly dye would spread evenly throughout a flume with no layers (Figure 6.). The next experiment investigated the behavior of dye injected into the lower, denser layer (Figure 7.). The dye spread throughout the bottom of the flume and began to mix into the top layer when it contacted the interface. Figure 14. Fine-scale stratification near surface maintaining itself despite being deformed by a surface convergence (pink mass at top). A school of fish is visible between the upper layers and the lower stratified layers. Objectives Figure 8. Profile of changes in absorbance over depth and time in a two layer system with dye added at the interface. Figure 9. Profile of changes in fluorescence (measure of phytoplankton density) over depth and time in a two layer system. Figure 15. Dense, fine layer of aggregation is present midway between sea floor and surface. Pink spots may be moving into layer to feed. A smooth layer is present at the surface. Methods When dye was injected directly into the interface (Figure 8.), it persisted mostly within the interface while some mixed into the upper layer. Over time, the upper layer increased in size and the interface dropped due to continued entrainment of heavier water from below. During this entrainment, the dye became evenly mixed throughout the upper layer, but did not move into the lower layer. Dye remained mostly in the interface while turbulence and mixing was low. If shear across the interface became large, turbulent mixing occurred, the interface deteriorated and the dye mixed evenly throughout the flume. Figure 10. Convergent zone in the coastal ocean (l) and corresponding acoustic image. Plume side is red, ocean side is green. Figure 16. Large, pink masses probably euphausiids. Organisms (light pink) are aggregating in the light green layer between the two groups of shrimp. Literature Cited Alldredge, A.L., T.J. Cowles, S. MacIntyre, J.E.B. Rines, P.L. Donaghay, C.F. Greenlaw, D.V. Holliday, M.M. Dekshenieks, J.M. Sullivan, J.R.V. Zaneveld. 2002. Occurrence and mechanisms of formation of a dramatic thin layer of marine snow in a shallow Pacific fjord. Mar. Ecol. Prog. Ser. 233:1-12. Clay, T.W., S.M. Bollens, A.B. Bochdansky, T.R. Ignoffo. 2004. The effects of thin layers on the vertical distribution of larval Pacific herring, Clupea pallasi. J. Exp. Mar. Biol. And Ecol. 305:171-189. Cowles, T.J. 2004. Planktonic Layers: Physical and Biological Interactions on the Small Scale. In: Handbook of Scaling methods in Aquatic Ecology, measurement, analysis, simulation. Edited by L. Seuront and P.G. Strutton. CRC Press, Boco Ratton and other places. Dekshenieks, M.M., P.L. Donaghay, J. Sullivan, J. Rines, T.R. Osborn, M. Tawardowski. 2001. Temporal and spatial occurance of thin phytoplankton layers in relation to physical processes. Mar. Ecol. Prog. Ser. 223: 61-71. Gallager, S.M., H. Yamazaki, and C.D. Davis. 2004. Contribution of fine-scale vertical structure and swimming behavior to formation of plankton layers on Georges Bank. Mar. Ecol. Prog. Ser. 267:27-43. Lasker, R. 1985. What limits clupeid production? Can. J. Fish. Aquat. Sci. 42 (Suppl. 1): 31-38. Treverrow, M.V. 2004. Observations of acoustic scattering from turbulent microstructure in Knight Inlet. Acoust. Res. Letters Online. 6(1):1-6.