Download
1 / 19
190 likes | 892 Views
Communities Travel Behaviour Change Project Component 2 – Evaluation Corporate Overview Leading global provider of professional services to resource & energy sectors

E N D
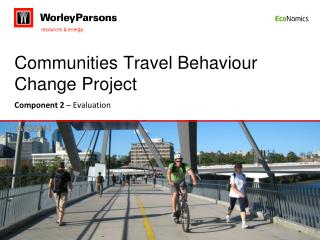
Communities Travel Behaviour Change Project Component 2 – Evaluation
Corporate Overview • Leading global provider of professional services to resource & energy sectors • Capabilities cover all aspects of transportation sector including rail, maritime (ports/harbours), roads, highways and intermodal transport • Master Planning, infrastructure engineering, policies, strategies and behaviour change 37 countries 114 offices 37,200 employees
Partnership Working • Consortium working to deliver complete solutions that meet customer needs • Local knowledge • Qualitative and quantitative survey design and implementation • Monitoring and evaluation • International perspective
National Context $21bn estimated cost per year of road congestion on the Australian economy 34% of household greenhouse gas emissions from transport (lighting contributes 5%) 33% proportion of urban land in Australia given over to roads and car parking • Sydney • 69% of journeys by private car • 10% by PT • 18% Walking • 1% Cycling • Melbourne • 75% of journeys by private car • 9% by PT • 13% Walking • 2% cycling
TravelSmart in Australia 1995 first TravelSmart project in Perth, WA following Metropolitan Transport Strategy 450,000 households in Perth now treated through TravelSmart process 8 all Australian States / Territories licensed under TravelSmart brand • 8 projects in • Western Australia • 143,000 hh • 10% reduction in car trips • Townsville (Queensland) • 10,000 hh • 8% reduction in • car trips • Brisbane North • (Queensland) • 74,500 hh • 13% VKT reduction
Project Areas • Brisbane South / Ipswich • Social Data (180,000 households) • Gold Coast • SKM (72,000 households) • Sunshine Coast / Caboolture • UrbanTrans (72,000 households)
Project Overview 324,000 households targeted in South East Queensland 10% targeted reduction in vehicle kilometres travelled (VKT) 3 different implementation methodologies
Government Policy / Existing Transport • Service Provision • Additional bus services in Brisbane area – 385 additional services providing 20,000 extra seats • 750,000 go cards issued – 400 sales outlets and 1,000 top-up outlets in SEQ • $7bn investment in transport infrastructure this year for SEQ • Coastal Issues • Coast creates long transport corridor • New rail station on Gold Coast • Sunshine Coast rail services inland, reliant on bus links to coastal towns • Improved bus services, but still poor and infrequent TravelSmart contributes to: Toward Q2 South East Queensland Regional Plan Transport Coordination Plan 2008-18 TransLink Network Plan Principal Cycle Network Plan ClimateQ, toward a greener Queensland
Types of Survey • Longitudinal research – qualitative and quantitative • South East Queensland Household Travel Survey
Focus Groups • 16 focus groups across Brisbane South, Gold Coast and Sunshine Coast • 8 groups with regular car users • 8 with regular PT users • Mixture of age, gender and locations in each group • Key findings: • PT and congestion are top of mind issues • Driving is the most preferred form of transport • Availability of services, reliability, frequency and safety among the main barriers to using PT • Walking/cycling seen mainly as leisure/sport activities coupled with poor perceptions of infrastructure, climate and safety “We need to get more public transport and get the cars off the roads” “Can do more things in one day with a car.” “Cycling is not a feasible form of transport due to climate and terrain”
SEQ Household Travel Survey 82% of all trips in Brisbane taken by car, rising to 87% on Gold Coast 92% of all work trips in Gold / Sunshine Coast taken by car (76% in Brisbane) 9.7km average distance per trip in Brisbane South • A survey including over 9,000 households • Including a stratified random sample of all occupied households within Brisbane, Gold Coast and Sunshine Coast • Collecting detailed data on travel patternsand behaviours • Using a one-day travel diary • Key findings: • Majority of trips taken by car (82% or more) • PT accounts for just 8% of trips in Brisbane and3% on the Coasts • Walking and cycling account for 10% or lessof trips in SEQ
Socio Economic / Demographic Factors • Car Ownership and Usage • More households own 3+ cars than none • Definite ‘car culture’ • Low density with de-centralised services • Australia has 2nd highest car ownership in the world, after USA • Demographic Trends • Increasing population across SEQ • Young demographic in Inner Brisbane, family orientated in suburbs • Coastal areas have high proportion of rental properties / holiday makers / backpackers • Large population of retired persons on the coast (particularly Sunshine Coast) SEQ
Current Attitudes 42% of car drivers stated there was no other way to get to work 68% thought driving their car was an important part of daily life 46% classified PT as a convenient way of getting around
Summary • Qualitative / Quantitative research suggests: • Poor perception and knowledge of local transport provision • Potential for modal transfer away from single occupancy car use • Case studies suggest: • Effective implementation program can achieve positive modal shift • Travel Behaviour Change projects can be a low-cost solution to congestion and mobility issues • Key outputs will be: • Analysis of change in attitudes / perceptions regarding transport modes • Shift in travel patterns – by mode, frequency, time and distance • Interpretation of how external factors impact on travel choice • Recommendations on effective implementation methodologies
Contact Us David Freer Katherine Evans WorleyParsons Steer Davies Gleave Brisbane, Australia London, United Kingdom david.freer@worleyparsons.com katherine.evans@sdgworld.net www.worleyparsons.comwww.steerdaviesgleave.com