Download
1 / 17
170 likes | 311 Views
Diets & Behaviour Change. How do people eat today? Sue Dibb sue@eating-better.org Twitter: @ Eating_Better. Data sources & comparisons. Food supply data ( eg FAO stats). Household purchase figures ( eg Defra Family Food Survey)

E N D
Diets & Behaviour Change How do people eat today? Sue Dibb sue@eating-better.org Twitter: @Eating_Better
Datasources & comparisons • Food supply data (eg FAO stats). • Household purchase figures (egDefra Family Food Survey) • Food eaten outside home? Historically not included (reliably post 2001-02) • Consumption data (eg National Diet & Nutrition Survey). Under-reporting? Raw weight/cooked weight/disaggregation. Waste. How up-to-date/responsive • Consumer research eg Kantar Worldpanel: Responsive/accurate/not public data • Qualitative data – what people think they consume (Ipsos Mori, YouGov) • Market data (value/volume?)
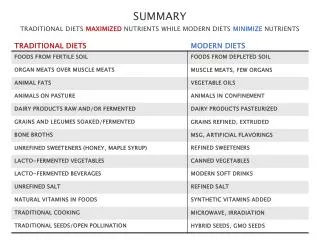
Definitions • Red meat = beef, veal, lamb, mutton, pork, goat (some attempts to redefine pork as white meat) • White meat = poultry • Processed meat includes ham, bacon, pastrami, salami, sausages, luncheon meats etc • Ruminants (cattle & sheep) monogastrics (pigs & chickens) • Carcase meat (raw) distinct from processed meat products
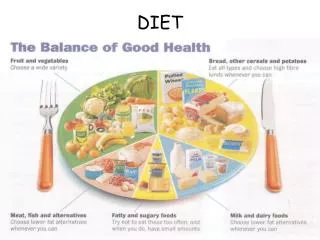
What type of meat are we eating • 40% poultry (mainly chicken) • 31% pig meat • 23% beef and veal • 6% lamb and mutton (Eblex 2011) UK not self sufficient in meat - Import 42% of domestic demand (58% pig meat)
Dairy consumption Liquid milk 80% Yog/fromagefrais 10% Cheese 6% Butter 2% Dairy Deserts (not frozen) 2% Cream 1% • Defra: Family Food 2012
Global meat consumption has almost doubled in the last 50 years from 63g (person/day) in 1961 to 115g (person/day) in 2009 (FAOSTAT 2013).
Gender differences • Men 226g/day Women 163g/day (meat & meat products) (NDNS, DH, 2011) • 6 out of 10 men and 4 out of 10 women exceed Gov advice to consume no more than 70g red& processed meat/day (Westland & Crawley, Healthy & Sustainable Diets in the Early Years 2012)
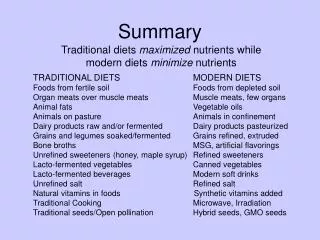
Trends • Meat: Family Food Survey: Overall consumption reportedly fairly constant (dating back to 1974). ?Food eaten outside home • 4 fold increase in take away consumption since mid-70s • Significant changes in types of meat • Significant increase in poultry 5 fold increase from 1961 • Long term trend: less beef (+BSE) & lamb • Reduction in carcase meat purchased, offal, corned beef • More processed meat products (sausage rolls, pasties, burgers, bacon, ham) • More ready meals/convenience foods. • Dairy consumption • long term downward trend in purchases of whole milk (– 29% 2009 – 12) • Increase in skimmed milk (+4.6%) Semi-skimmed/skimmed milk sales stable last ten years (overtook whole milk in 1990s) • Cream (+8.3%)
Impacts of recession • Effect of recession different: not just less money to spend but also increases in food prices. (IFS) • Retail price of meat increased 35% 2007 – 2013 (ONS) • People spending less and trading down (cheaper calories) (Kantar World Panel) • On average, UK households purchased 4.7 per cent less food in 2012 than in 2007 while spending 17per cent more. Saved 5.6% by trading down to cheaper products (Defra, Family Food 2012) • Lowest income group spent 22% more on food, purchased 5.7% less but only saved 1% by trading down. • In 2010 poorest 10% of consumers brought 26% less fresh meat than in 2007 (Defra) and more frozen and processed foods (also fewer fruit and vegetables)
Impact of Horsemeat Scandal 2013? • You Gov survey for Eating Better (Sept 13) 25% said they were eating less meat than a year ago with ready meals & processed meats most likely off the menu. • Grocer survey (Dec 13) 69% said didn’t have an impact on food purchasing • Betrayal of trust (53%) Food system not robust (48%) • Frozen burgers/ready meals were rightly identified as affected • Local butchers did well out of it
Cutting back & trading down 2013 • 1/3rd less likely to buy organic, or buy meat in premium supermarkets • 25% more likely to buy British meat • Economic climate + horsemeat = confusing picture • Trading down + trend to less processed meat + avoiding cheaper meat ranges
Attitudes: increase in sales of ethical produce Ethical Consumer Markets Report (ECR), 2012, The Co-operative Group
Attitudes to meat • Defra (2011) majority of people say open to changing their diet to help the environment. 63% willing to cut down on red meat; 45% dairy; 76% confectionery. • Eating Better (2013) third willing to consider eating less meat, around 50% willing to pay more for ‘better’ meat (eg taste, healthier, higher animal welfare, better returns for farmers) – not just higher social grade groups • Young people more likely to say don’t eat any meat (1 in 6) • FSA (2012) safety of meat from outside UK of most concern • WRAP: 13% of meat is wasted (household) • We like it (50% said it was favourite part of their meal) • Cultural significance (meat & 2 veg)
What don’t we know • Detailed, timely & comparable consumption figures • Consumption data doesn’t distinguish how meat is produced • What dishes people eat? How cooked/served? • No quantitative dietary model that describes how to achieve a diet that is both healthy & sustainable (how much meat/of what type/for different consumers) • Relevant to individual behaviour – how much do I eat? • Future trends?