Download
1 / 25
250 likes | 362 Views
Reporting Facts and Relevant Post Show Data. Marc L. Goldberg, CME marketech360. How was the show?. Great! Our exhibit was packed every day. The giveaway really worked!. But, if you responded. Leads generated: 35 “A” leads, 75 “B” leads, 125 “C” leads Visual reach:

E N D
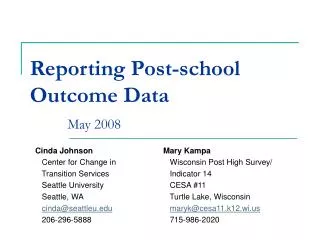
Reporting Facts and Relevant Post Show Data Marc L. Goldberg, CME marketech360
How was the show? Great! Our exhibit was packed every day. The giveaway really worked!
But, if you responded • Leads generated: • 35 “A” leads, 75 “B” leads, 125 “C” leads • Visual reach: • 12,500 visitors were visually reached by the exhibit. • With a budget of $150,000, our cost per person reached was $12.00 • Demonstrations: • 1500 demonstrations – budget $5,500 or $3.66 per visitor reached by a demonstration
The maybe syndrome • Gut feel and the “maybe syndrome” don’t work!
This all presupposes • You set objectives
Analysis by slicing & dicing • A,B,C leads – number in each category • Job titles i.e., buying potential • Geographic origin analysis • Company activity analysis • Annual marketing budgets • Product type • Occupation • Actions – next steps
Potential Return on Investment • 101 qualified leads • 101 qualified leads with a potential value of $750,000 • And your investment was $65,000 • Now….. You can generate Potential ROI 11.53:1
Return on product demonstrated • What is the cost to conduct the demo? • How many demos were conducted? • Cost per person reached? • Use the lead card as a survey… then you can generate potential and Potential ROI on the demonstration investment
Impact of a live presentation • Investment in the live presentation • Number of visitors participating • Capture information about their inclination to buy or recommend as a result of the live presentation • Now…Potential ROI on the live presentation investment
Results from a hospitality • Investment in the hospitality? • Number of current customers / prospects participating • New business uncovered? • Now…Potential ROI on the hospitality investment or • Actual value of new business generated
Show Audit • Attendee profile demographics • Unique visitations • Total number of visits • Total attendance
Budget vs. Actual Cost per person reached – hospitality Cost per contact Cost per potential visitor Cost per touch Cost per impression – sponsorship Cost per lead Writing orders – cost per written order Actual ROI Cost per person reached – live theatre Cost per recruited person Cost per person demonstated Brand impressions Cost per person reached – physical Quantitative metrics
Final report • Potential business • Attendees – quality and quantity • Demonstrations • Promotions • Competitive intelligence • Media • Customer Feedback • Sessions attended • Trends • Recommendations
Show Addendum post show report Interaction Results AACE 2007 American Association of Clinical Endocrinologists http://www.aace.com Washington State Conv. & Trade Center Seattle, WA April 11-15, 2007 Cost Analysis Show Summary
ABC Pharma Corporate and Brand Presence • ABC Pharma’s presence was felt at many different touch points throughout the five day meeting. Products were visible via pre-show sponsorships of the meeting planner, daily show news, and symposium. At-show presence was marked by the inaugural of the new exhibit. The booth was positioned front and center for all convention attendees, as they entered the exhibit hall, to see and experience. Highlights include: • The dramatic LED wall welcomed all attendees to the hall, the expo, the city and to the new ABC Pharma exhibit. • Exhibit staff used the e-detail e-detailing and lead system captivating individual • HCPs as well as large groups for an average of 5minutes 52seconds. • Large 6 foot ABC Pens™ and DEF Pens™ were displayed at front of exhibit. • Large scale imagery and branding graphics were displayed through out the booth. • Medical Affairs - Staffed by 3 MSLs • Hospitality Bar - Whole fruit served with ABC Pharma branded water bottles. Show Summary • Show Background • AACE is a professional community of Clinical Endocrinologists that is committed to transforming the lives of patients by enabling one another to practice leading edge, proactive, ethical and cost-effective medicine. • The 16th Annual meeting is structured to provide relevant clinical information for the practicing endocrinologist. • 70 exhibiting companies • Conference Theme: Scaling the Heights of Endocrinology • Show Demographics • The following data is consistent from 2005-07: • Clinical Endocrinologists make up 90% of the total attendance • International visitors account for 16-18% of the total attendance. Seattle Chicago Boston AACE 2007
Interaction Goals Summary Interaction Results • Measurable Data History • AACE marked not only the major debut of the new exhibit but of a new comprehensive system for key meetings. Up to this point ABC Pharma employed the use of association-issued lead scanners. These scanners were located within all product areas and medical affairs where attendee’s badges were scanned for basic info. Although tracking was possible for each product group; the system could not establish the following: • Quality of interaction – message delivery with consistency and clarity. • Real time flagging of physicians presence on target list • Average time spent with ABC Pharma representative e-detail Pen Pod • e-detail Results • This “Return on Interaction” system was able to provide real time results with the ConventionLinkDirect! reporting. In addition to the above goals set e-detail was able to: • Create “in-booth sales calls” • Encourage convention follow-up via field sales • Post-show – provide true ROI calculation for cost evaluation after show AACE 2007
Interaction Demographics Interaction Results 2007/2006 Lead Comparison The total number of leads in 2007 increased compared to 2006 despite the decrease in total meeting attendees. Traffic Flow Consistent with previous traffic flow patterns, Diabetes declined 80% the second day of exhibits, and Product B® decreased 70%. Nearly 60% of all leads were captured on the first day of the show. AACE 2007
Diabetes Interactions Interaction Results Product B® Interactions Donation A donation experience was offered to each HCP that participated in the e-detail interaction. HCPs were offered the opportunity to contribute to one of the following three charities: Save the Children , Project HOPE, and Puget Sound Neighborhood Health Centers AACE 2007
Show Cost Analysis Cost Analysis • Cost Comparison • There was a 15% total cost savings in 2007 compared to 2006, despite adding 250 sqft. of exhibit space. • Booth campaign and lead retrieval costs are noticeably different due to new program changes. • 2007 Cost per Lead was $156 compared to $12 spent in 2006 per lead which was a 92% cost increase. Sponsorship Costs Summary AACE 2007
Competitor Analysis Show Addendum • Highlighted Competition • Competitor 1 • One’s 20x30 exhibit was extremely crowded with both staff and property. The exhibit was dark, which did not make it very inviting. • They had 13 staff working the convention, including several Ambassadors to assist with traffic flow. • One also promoted Genotropin and Lyrica in this exhibit. • Competitor 2 • The 30x30 exhibit was mostly open and inviting. They were not visible from the front of the hall due to the ABC Pharma LED signage. • They had four selling stations with staff positioned near them at all times. Two devoted to Lantus and two allocated to Apidra. • Their staff dressed in business attire appeared primarily reactive and did not • proactively engage HCPs. • The core promotional piece was a Rx pad. AACE 2007
Competitor 3 • The exhibit was similar in structure and color combinations to those observed at past events. • Four selling stations were arranged on the exhibit corners utilizing 42” plasma screens to display product information. Virtually no one was observed viewing them nor did the staff use them in their dialogues. • Three stations were dedicated to Three. • Exhibit staff tended to use the print materials to emphasize specific points while communicating with attendees. Show Addendum • Innovative and inviting custom exhibit property • High-tech e-detail e-detailing stations at aisles • Large-scale replicas of ABC Pens™ and • DEF Pens™ • Hospitality area served branded bottled water • and whole fresh fruit • Donation opportunity • Branded giveaways Debut Exhibit Layout & Photos • Exhibit was positioned at the only entrance to the Washington Convention Center’s exhibition hall. • The LED message screen welcomed attendees to the ABC Pharma experience providing a hierarchy of messaging. • The location was sufficiently set back from the doors to avoid the “zoom-past-fast” syndrome that is normally associated with this location. • The refreshment station was centrally located and encouraged access to detail and messaging areas. • Larger than life graphics that were eye-catching and provided effective hierarchy of messaging for the visitors. • Exhibit was open and inviting with 11 interaction areas without overcrowding. • Medical Affairs area was able to achieve the separation / identity from the rest of the booth with it’s position along a convex curved wall. • Integrity of design was not compromised and traffic flow was enhanced. AACE 2007
Partner Evaluation Summary • What Worked • The LED screen was very attracting and • set the environmental mood of “change” and innovation. • Smaller, pedestal type • demonstration/presentation stations • Pods to accommodate overflow from • one station to another. • Branded towers on two sides of the • exhibit supplemented with individual • stations. This allowed the staff to engage • visitors on all four sides of the exhibit. • The refreshment station that was integral to the • flow of the exhibit providing access to detail and • messaging areas. • Larger than life graphics that were eye-catching • and provided for effective hierarchy of messaging • for the visitors. • Open and inviting environment Show Addendum • What Needs Attention / Recommendations • Have adequate staff for the number of demo stations offered • Create graphics that are benefit statement oriented vs. reprints of sales aids. • Have enough staff to act as floaters to pick up attendees who stop for a refreshment . • Make sure there is time set aside before the meeting/expo opens for every representative to walk through and get comfortable with the One World presentation. • Reduce the number of MSL personnel commiserating within the space for Medical and Scientific Affairs. AACE 2007
Transmitting the report of findings • Keep your target in mind • Keep it as short as possible and still tell the story • Use both charts, graphics and prose • Deliver and present it in person, if possible • Organize a post show briefing • Deliver the results in person • Make the debrief the foundation for the next event
Trade Show Work! When you, Plan Completely Execute Aggressively and Enthusiastically Follow-up Thoroughly