Download
1 / 15
150 likes | 287 Views
Reporting and Data Analytics. Presented By: Parisa Tashakori. Why Reporting? “ If you can’t measure it, you can’t manage it” “If you can’t measure it, you can’t improve on it”. Data Analytics is defined as the technology and the associated tools for Data Analysis. Analytics.

E N D
Reporting and Data Analytics Presented By: ParisaTashakori
Why Reporting? “If you can’t measure it, you can’t manage it” “If you can’t measure it, you can’t improve on it”
Data Analytics is defined as the technology and the associated tools for Data Analysis.
Analytics Reporting: What did happen? Analysis: Why did it happen? Monitoring: What is happening now? Forecasting: What might happen? Predictive: What is likely to happen? Prescriptive: What actions should be taken?
Connexall Data Nurse Call Portering Request Event Housekeeping Request Disptacher assigns task to poter Activity Nurse cancels the call Housekeeper acknowledges message on his phone
Connexall Events: • Page Message Events • Page Activity • Device Activity • User Activity • Callpoint Events • Callpoint Activity • Device Activity • User Activity
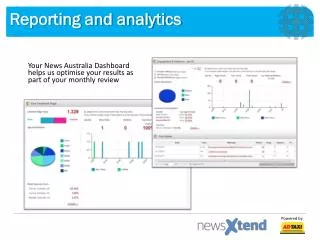
SSRS reports Features You can have your own copy Accessible from everywhere Enhanced Reports, New Reports and more Accessible for everyone Automatically delivered to your email
Connexall SSRS Reports features: • Reports include Bar chart, line chart, pie chart, gauge, trend and heatmap graphical components. • Reports can compare up to three parameters. • Reports use different time scales. • Reports show numerical values in matrix. • Components to be shown can be configured for reports. • Reports are linked together.
Do you have different needs? • Export raw data to excel using respective SSRS report and use excel reporting features. • We can develop customized reports for your specific needs. There is no limit in the possibility of representing your data in the way that you need.