Download
1 / 49
490 likes | 626 Views
Raging Growth: Algae and Impacts to Wildlife. Dr. Jeffrey M. Reutter Director, Ohio Sea Grant College Program and Stone Laboratory. Today’s Goals. Lake Erie history and how it works N utrient and algae relationship Harmful algal blooms (HABs) How to solve them.

E N D
Raging Growth: Algae and Impacts to Wildlife Dr. Jeffrey M. Reutter Director, Ohio Sea Grant College Program and Stone Laboratory
Today’s Goals • Lake Erie history and how it works • Nutrient and algae relationship • Harmful algal blooms (HABs) • How to solve them
Jeffrey M. Reutter, Ph.D., Director • 1895—F.T. Stone Laboratory • 1970—Center for Lake Erie Area Research (CLEAR) • 1978—Ohio Sea Grant College Program • 1992—Great Lakes Aquatic Ecosystem Research Consortium (GLAERC) • Grad student at Stone Lab in 1971 and never left. Director since 1987.
What is Ohio Sea Grant? • Part of National Sea Grant Collage Program in NOAA • 32 programs—every coastal state • Partnership of: • Government • Academia • Private Sector • Focus on 3 E’s: • Environment • Economy • Education • Accomplish through: • Research • Education • Outreach
What is Stone Lab? • Oldest freshwater field station in the nation • Ohio’s Lake Erie Lab since 1895 • Island campus of OSU on Gibraltar Island, Lake Erie • Research, education, and outreach laboratory for Ohio Sea Grant
Lake Erie: One of the Most Important Lakes in the World Dead lake image of 60s and 70s. Poster child for pollution problems in this country. Most heavily utilized of any of the Great Lakes—shipping, boating, commercial and sport fishing, beaches, drinking water 11 million people, etc. Most challenging to manage—shared by 4 states, a province, and 2 countries. Best example of ecosystem recovery in world—Dead Lake to Walleye Capital of World
Great Lakes Land Use Image: Ohio Sea Grant
Because of Land Use, Lake Erie Gets: More sediment More nutrients (fertilizers and sewage) More pesticides (The above 3 items are exacerbated by storms, which will be more frequent and severe due to climate change.) And Lake Erie is still biologically the most productive of the Great Lakes—And always will be!!
50:2 Rule (Not exact, but instructive) Lake Superior: 50% of the water and 2% of the fish Lake Erie: 2% of the water and 50% of the fish
80:10:10 Rule 80% of water from upper lakes 10% from Lake Erie tributaries 10% direct precipitation
Nutrients: Problem or Benefit? On our lawns, they make our grass grow In water, they make algae and plants grow Lake Erie is most productive Great Lake because: shallowest, warmest, and most nutrients. But it is possible to have too much of a good thing. Too many nutrients leads to too much algae and the wrong kinds of algae
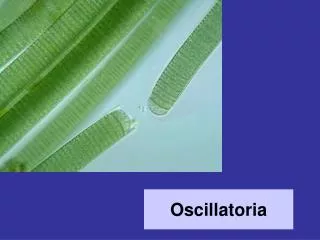
Algae are tiny plant-like organisms that live in water There are hundreds of species of algae in Lake Erie. Most are beneficial. • Source: Tom Bridgeman, UT
Major groups/kinds in Lake Erie Diatoms Greens Blue-greens (Cyanobacteria) • Source: Tom Bridgeman, UT
What HABs?Harmful Algal Blooms Blooms of algae, typically blue-green algae or cyanobacteria, capable of producing toxins
Cyanobacteria in Lake Erie Microcystis Anabaena Aphanizomenon • Source: Tom Bridgeman, UT
Historical Trends:The Lake Erie Ecosystem 1969—Cuyahoga River burns Getting worse annually to 1970 Stable 1970-75 Improving 1975-1995 1995+ Getting worse Photo: Ohio Sea Grant
Blue-green Algae Bloom circa 1971, Lake Erie Photo: Forsythe and Reutter
Why does Lake Erie get the most nutrients? The most agriculture in its basin Few forests Wetlands gone Large human population—water treatment, septic tanks, sewage treatment (or lack thereof)
What brought about the rebirth? Phosphorus reductions from point sources (29,000 metric tons to 11,000);and agriculture helped!
Why are we targeting phosphorus? Normally limiting nutrient in freshwater systems P reduction is best strategy ecologically and economically It is our goal now!! Reducing both P and N would help!!
Phosphorus Sources • 1960s and 70s—primarily point sources (2/3) • Today loading is coming primarily from agriculture (2/3) but other sources include: • Sewage treatment plants and CSOs • Lawn fertilizer runoff • Water treatment plants • Septic tanks
Impacts of Increased Phosphorus Concentrations • HABs—If P concentrations are high (regardless of the source, Ag, sewage, etc.) and water is warm, we will have a HAB (nitrogen concentration will likely determine which of the 6-7 species bloom) • Nuisance Algae Blooms • Cladophora—Whole lake problem. An attached form. • Dead Zone in Central Basin
HAB Requirements Warm water (summer problem but now finding them in Maumee River as early as April) High phosphorus levels Zebra/quagga mussels (not required but remove competition)
Microcystis, Stone Lab, 8/10/10 Photos: Jeff Reutter
Microcystis in Lake Erie • The Microcystis-Anabaenabloom of 2009 was the largest in recent years in our sampling region • …until 2011 Source: Tom Bridgeman, UT 2011
August 11 2011 1330 cfs Photo: NOAA Satellite Image
October 9, 2011 Photo: NOAA Satellite Image
Microcystis near Marblehead October 9, 2011 Photo: Richard Kraus, United States Geological Survey
Are HABs only a Lake Erie and Ohio Problem? Global problem Serious problem in US and Canada Common species in Lake Erie is Microcystis sp. Dominant form in Grand Lake St. Marysin 2010 was Aphanizomenon sp., the same species that bloomed in Lake Erie in the 60s and 70s
Grand Lake St. Marys July 2010
Microcystin Concentrations 1 ppb WHO drinking water limit 20 ppb WHO swimming limit 60 ppb highest level for Lake Erie till 2011 84 ppb highest level for Grand Lake St. Marys till 2010 2000+ Grand Lake St. Marys 2010 1200 Lake Erie Maumee Bay area 2011
HAB Impacts Have killed people around world and dogs in Ohio Not useful to healthy lake food webs Reduce fish diversity and numbers of target species Eliminate rooted aquatic plants Reduce coastal property values Make Dead Zone worse And more
Nutrient Loading Majority of loading occurs during storm events 80-90% of loading occurs 10-20% of time 2012 = dry spring and low load—a very good thing!!
Climate change is making these problems worse! • Warm water favors HABs • Warm water increases oxygen depletion rates • More severe storms will resuspend more sediment and increase erosion and nutrient loading • Critically important point—with no changes in Ag practices, warmer weather and increased frequency of severe storms could increase negative impact of existing practices. • Lake levels—uncertain/probably down
Increased Frequency of Rainstorms Changes in frequencies of storms in the Midwest, by category of storm size for five decades, 1961-1970 through 2001-2010. Labeled changes are for the last decade. Comparisons are to frequencies in 1961-1990. Source: Rocky Mountain Climate Organization and Natural Resources Defense Council.
Maumee Discharge in 2011 & 12: the Perfect Natural Experiment
NOAA HAB Forecast—7/5/2012 • Loading from March through June is critical point • Drought leads to low rainfall and runoff • Heidelberg data shows loads lowest in 40 years • UT data show Maumee Bay concentrations less than 1/10 of 2011 • Therefore, 2012 bloom will be less than 10% of 2011 bloom in Western Basin and similar to 2007.
Microcystis in Lake Erie Source: Tom Bridgeman, UT Justin Chaffin, Ohio Sea Grant and Stone Lab
Target Loads to Solve Problem Leading subcommittee of the Ohio Phosphorus Task Force to identify both spring and annual target loads of both total P and DRP to prevent or greatly reduce HABs
Expected Time for Recovery Because Lake Erie is the smallest of the Great Lakes by volume, the retention time for water in the Lake is very short compared to the other 4 lakes—Western Basin retention time is 20-50 days. Therefore, if reduced loading targets are reached, recovery will be almost immediate. This is not true of every lake!! 2012 proved we were right!!
For more information:Dr. Jeff Reutter, Director Ohio Sea Grant and Stone Lab Ohio State Univ. 1314 Kinnear Rd. Col, OH 43212 614-292-8949 Reutter.1@osu.edu ohioseagrant.osu.edu Stone Laboratory Ohio State Univ. Box 119 Put-in-Bay, OH 43456 614-247-6500