Download
1 / 25
270 likes | 859 Views
OFF DESIGN PERFORMANCE PREDICTION OF STEAM TURBINES. P M V Subbarao Associate Professor Mechanical Engineering Department I I T Delhi. A circular Peg in Square Hole….. Not A Good Fit…. Principle methods of load reduction. Throttle governing Nozzle control governing Bypass governing

E N D
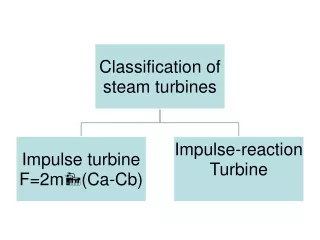
OFF DESIGN PERFORMANCE PREDICTION OF STEAM TURBINES P M V Subbarao Associate Professor Mechanical Engineering Department I I T Delhi A circular Peg in Square Hole….. Not A Good Fit…
Principle methods of load reduction • Throttle governing • Nozzle control governing • Bypass governing • Combination of the above
ppump Steam Generator Pump DpSG Dpvalve PART-LOAD OPERATION • The demand to utility network is not constant and generating units do not always operate at full load. • A simplest way of varying steam flow rate is by throttling (controlling through A Valve). The flow rate is controlled by increasing pressure drop across the valve.
Dpvalve Dpvalve Dpvalve Flow Characteristics of A Throttle Valve Dpvalve Dpturbine Mass Flow Rate of Steam A decrease in mass flow rate of steam is associated with a drop in turbine inlet pressure
Steam rate Willians Line • Relationship between load and steam consumption for a turbine governed by throttling is given by the well-known Willians line. Steam flow rate ( kg/sec) and steam rate( kg/kJ) Load ( k), kW
Expansion lines of the Non-rehat Condensing turbine Exit from governing stage P P1 Design flow expansion line Enthalpy , h Design flow expansion line Entropy ,s
Enthalpy , h Entropy ,s Throttle governing of a steam turbine on the h-s diagram
Nozzle box pressure p Absolute steam pressure Pressure in stage 1 (HP) Pressure in stage 2 (IP) Pressure in stage 3 (LP) m1 Steam flow through turbine m0 m0 various from one machine to another and is generally in the range of 10 to 14% of full load value. m is the slope of the willians line and therefore is the change of steam flow rate per unit change of turbine load. Pressure variation………. As the steam turbine system various its operation to satisfy the demand, steam pressure at various turbine locations change accordingly.
Nozzle control governing • The steam consumption rate is much smaller for the nozzle control than for throttle control. • At full load, all the nozzles will be delivering steam at full pressure and the turbine will be operate at maximum efficiency. • At some part load condition one group of nozzles may be shut off while the other nozzles are fully operated. • THROTTLING EFFECTS ON STEAM WILL BE EITHER ELIMINATED OR MINIMIZED !!!!!!!!!!!
By pass Governing To produce more power ( when on over load) additional steam may be admitted a by-pass valve to the later stage of the turbine.
Procedure for calculating Extraction Pressure during part Load operation Step 1 : Assume the steam extraction pressure (Say design value multiplied by the throttle steam flow rate ratio). Step 2 : Steam flows for feedwater heating are determined by using the principle of energy conservation. Step 3 : If the calculated value are not within a desirable range of the assumed, the new values for extraction pressures must be assumed and the new heat balance repeated. Step 4 : In general, it takes three or four trials before the extraction pressures are correctly estimated.
Regenerative Feed Water Heater Extraction Steam Flow Variation with Varying Load
Upstream and Downstream Pressure Correlations The flow of extraction steam through the NRV can be safely assumed analogous with flow through orifice.
The normalized correlation between Upstream and Downstream Pressures: The normalized correlation between Upstream and Downstream Pressure Difference and Mass Flow Rate:
The relation between pressure variation and mass flow in the multi stage turbine groups is expressed by the Ellipse Law , proposed by stodola. • This law when applied to cases of non-controlled expansion in multi stage turbines, employ the definition of flow coefficient Φ , in m2 ,described by the following equation: • In which m is the steam mass flow rate ( kg/sec) • P= Pressure (kPa) • v=specific volume • The stodla ellipse law states that,
Where Bi is the static pressure in the outlet of the group (kPa) and pi is the total inlet pressure of this same group. • This relation is only applied for group with a very large number of stages, but is can be applied for at least eight-stage groups with 50% reaction. The proportionality in the former equation can be eliminated as follows: • Where the subscript D means design conditions. Flow coefficients follow equation 1. Cook(1985) suggests that a fairly good approximation is obtained by taking steam static pressure Bi at the outlet of a given group as the inlet steam pressure of the next one, pi+1. • By rearranging the last equation, one obtains
Where YiD = (P2ID- B2iD) / ( p2 iD ΦiD) is the stodla constant. Note : This coefficient depends directly on the ratio between inlet and outlet steam pressures of the turbine. In such case, the control valve of the turbines are kept totally open, and pressure control at the turbine inlet is achieved by the boiler and main pump of the plant.
At part load operation , steam flow rate reduces the velocity ratio ( u/Vai). • On load variations the enthalpy drops in the last stages of turbine and in the governing stages of turbines with nozzle distribution are subjected to the greatest changes. • In case of decrease in enthalpy drop ( ho) the absolute velocity of steam exit from the nozzle cascade decreases and the velocity ratio increases . • The increased velocity ratio causes a negative incidence angle and steam flow strikes the suction side of the blade. It also increases the degree of reaction and the leakage loss increase. Thus it reduces the stage efficiency.
OFF-DESIGN IMPACT • (A) Variation of Main Steam Flow: • (1) Effect on Pressures of Different Stages • MS Pressure remains constant • 1st Stage pressure decided by flow rate • Pressures of all stages are lowered • (2) Effect on Temperatures of Different Stages • MS Temperature remains constant • Temperatures of all HP stages are lowered • Temperatures of other stages not changed much except LP last stages • (3) Effect on Enthalpy Drops of Different Stages • Enthalpy drops of all HP stages are lowered • Enthalpy drops of other stages not changed much except LP last stages
(4) Effect on Losses of Different Stages • Nozzle & Moving Blade Exit velocity loss decrease with load (HP stages) • Not much variation in IP & LP stages (except last LP stages) • Profile loss and cumulative loss vary according to load variation • Effect visible in HP stages but not in other stages (except last LP stages) • Last stage Exit velocity loss proportional with load variation • (5) Effect on Efficiencies of Different Stages • For 210 MW turbine, more or less the same except last LP stages • For 500 MW turbine, efficiencies of HP and IP initial stages less at part load • (6) Effect on Internal Power of Different Stages • Varies proportionally with mass flow rate for all stages. • (7) Effect on Cycle Efficiency & Heat Rate of Different Stages • Cycle Efficiency deteriorates and Heat Rate increased with lower mass flow rate
Variation of Main Steam Pressure: • (All effects are limited to HP Stages only) • Effect on Losses of Different Stages • At higher pressure, more throttle loss • Other losses increase at higher pressure • (2) Effect on Efficiencies of Different Stages • HP Stages efficiencies remain almost constant at different pressure • (3) Effect on Internal Power of Different Stages • Internal power of HP stages increase with increased pressure • Effect on Cycle Efficiency & Heat Rate of Different Stages • Cycle Efficiency deteriorates and Heat Rate increased with lower Main Steam Pressure
Variation of Main Steam Temperature: • (All effects are limited to HP Stages only) • Effect on Enthalpy Drops of Different Stages • Enthalpy drop of each HP stages increase with rise in MS Temperature • (2) Effect on Losses of Different Stages • Nozzle & Moving Blade Losses increase with Temperature rise • Profile loss & Cumulative loss increase with Temperature rise • (3) Effect on Efficiencies of Different Stages • HP Stages efficiencies remain almost constant at different temperatures • (4) Effect on Internal Power of Different Stage • Internal power of HP stages increase with increased temperature • (5) Effect on Cycle Efficiency & Heat Rate of Different Stages • Cycle Efficiency deteriorates and Heat Rate increased with lower Main Steam Temperature
(D) Variation of Re-heat Steam Temperature: • (All effects are limited to IP and LP Stages only) • Effect on Enthalpy Drops of Different Stages • Enthalpy drop of each IP and LP stages increase with rise in RH Steam Temperature • (2) Effect on Losses of Different Stages • Nozzle & Moving Blade Losses increase with Temperature rise • Profile loss & Cumulative loss increase with Temperature rise • (3) Effect on Efficiencies of Different Stages • Slight improvement in Stage Internal Efficiencies at lower RH steam temperature • Effect on Internal Power of Different Stage • Internal power of both IP & LP stages increase with increased RH steam temperature • (5) Effect on Cycle Efficiency & Heat Rate of Different Stages • Cycle Efficiency deteriorates and Heat Rate increased with lower Reheat Steam Temperature
(E) Variation of Condenser Pressure: • (All effects are limited to LP last few Stages only) • (1) Effect on Pressure of Different Stages • Pressures increase with increase in Condenser pressure (LP last 3-4 stages) • (2) Effect on Temperature of Different Stages • Temperatures increase with increase in Condenser pressure (LP last 3-4 stages) • Effect on Enthalpy Drop of Different Stage • Per stage Enthalpy drop decreases sharply with increase in Condenser pressure (LP last 3-4 stages) • Effect on Losses of Different Stages • Losses increase with increase in Condenser pressure (LP last 3-4 stages) • Effect on Efficiency of Different Stages • Stage Efficiency decreases with increase in Condenser pressure (LP last 3-4 stages) • (6) Effect on Cycle Efficiency & Heat Rate of Different Stages • Cycle Efficiency deteriorates and Heat Rate increased with higher Condenser Pressure