Download
1 / 21
210 likes | 320 Views
Past and Future Changes in Extreme Sea Levels and Waves Session Chair: Philip Woodworth and Jason Lowe Rapporteur: Kathleen McInnes Philip Woodworth, “Evidence for Changes in Extreme Sea Levels and Waves in the Recent Past” (15 min)

E N D
Past and Future Changes in Extreme Sea Levels and Waves Session Chair: Philip Woodworth and Jason Lowe Rapporteur: Kathleen McInnes Philip Woodworth, “Evidence for Changes in Extreme Sea Levels and Waves in the Recent Past” (15 min) Ruth McDonald, “Mid-latitude and Tropical Storms / Simulated Changes in Atmospheric Drivers of Extreme Sea Levels” (15 min) Thomas Knutson, “Tropical Cyclone Intensities: Recent Observation and Simulation Response to CO2-induced Climate Warming” (15 min) Jason Lowe, “Simulated Changes in Extreme Water Levels” (25 min) Discussion and Recommendations
Evidence for Changes in Extreme Sea Levels and Waves in the Recent Past Philip Woodworth Proudman Oceanographic Laboratory
X(t) = T(t) + S(t) + Z(t) where X = still water level T = tide S = surge (or residual) Z = slowly varying level (MSL) Z could be trend or decadal variability or ENSO signal S depends primarily on changing meteorology (or eddy activity for example)
Tide Gauge Records • Are extremes (X) increasing? • Are extremes (X) increasing in line with MSL (Z)? • Or in line with S? (or with both ?)
99 Percentile Trends since 1975 (Woodworth and Blackman, 2004 J. Climate)
Tide Gauge Records Longer Timescales • number of studies of a relatively small number of sites e.g. Brest, Newlyn, San Francisco, Venice, Australia (see Position Paper for references) • information largely support extremes rising in line with MSL but there are exceptions
Concerns about Tide Gauge Data Sets • Global representation limited: • Southern hemisphere • Most sensitive areas e.g. Bangladesh little data • Data on extremes harder to find than MSL • Identification of the real extreme (due to sampling etc.) • Need to accommodate changing data sampling (e.g. high waters in 18-19th centuries, hourlies in 20th century, higher frequency now)
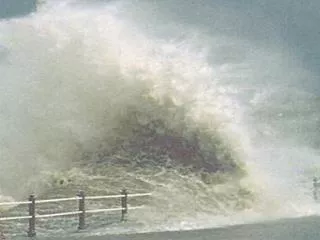
Extreme sea level (storm surge) Bangladesh 1970. Over 300,000 killed
Bay of Bengal Major Surges 1737 300,000 killed 1864 100,000 1876 100,000 1897 175,000 1970 300,000 (tide plus 6m surge) And at least 23 surge events with over 10,000 killed since 1737 These considered lower limits as economic damage adds to eventual total (Murty, Flather and Henry, 1986 Progress In Oceanography Murty and Flather, 1994 Journal of Coastal Research)
Surge Modelling (Changes in S) • Meteorological reanalyses (ERA, NCEP etc.) allow long runs (typically 50 years) of barotropic models. • NE Atlantic/North Sea: • Flather et al. (Tsimplis, Wakelin etc.) • Langenberg et al. (von Storch etc.) • NW Atlantic: • Bernier and Thompson • Mediterranean: • Tsimplis et al. (Alvarez-Fanjul, Perez)
North Sea Langenberg et al. – trends in extremes (high percentiles) over 50 years largest in German Bight and small around UK coast. Subtraction of winter means reduced the larger trends. POL – measured trends of extremes very sensitive to epoch – statistical properties of 99 percentiles similar to those of MSL e.g. relationship to NAO North West Atlantic Bernier and Thompson – slightly reduced extreme surges due to reduction in IB forcing
Winter MSL vs. NAO Winter 99-percentile vs. NAO
Technical Concerns Surge Modelling • Homogeneity of meteorological fields (WASA 1998) • Spatial and temporal resolution of models may not capture character of high frequency events • Need to combine tide+surge extremes with wave and river flow extremes into joint probability risk (can be very localised)
Overall Conclusions on S • large trends in extremes can be obtained when measured over several decades • changing the epoch can radically alter the trend • little overall evidence from tide gauge data, surge modelling, or met data for changes in storminess over century timescales
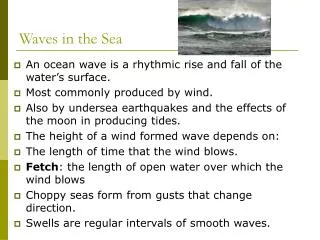
Changes in Waves (NE Atlantic) • NE Atlantic wave heights have increased in last 50 years related to NAO (see references in Position Paper) • Due to increased swell rather than wind waves • Relative importance of strength of westerlies or latitude shifts of storm tracks, both NAO-related (? Discussion) • But present wave climate comparable to start of 20th century (WASA)
Changes in Waves • N Pacific wave heights increased over last 20-30 years (buoy records and hindcast wave models) • Since 1958, VOS data show increases in N Atlantic, N Pacific, W subtropical S Atlantic, E equatorial Indian, East and S China Seas • For 1957-2002, the only areas with wave height trends different from zero are N Atlantic, N Pacific and south of Australia (KNMI/ERA-40 Wave Climatology Reanalysis) • Since 1902, VOS data show increases N Pacific, and decreases N Atlantic
Overall Conclusions on Waves • large trends in extremes can be obtained when measured over several decades • little overall evidence for changes over longer timescales • This is similar to the conclusions on extremes in still water levels
Discussion topics (examples): • Can long pressure records be used to learn about storminess? • Is relationship between wave height and NAO in N Atlantic depend on wind speed or storm track position ? • Will the frequency of hurricanes increase in a warmer world ?
Recommendations • Extend the evidence base (historical data sets, monitoring extended) • Extend regional modelling of surge variability (past and future) • Extend regional and global wave hindcast modelling • Extend tide+surge risk estimation to joint probability with waves and river flows and their interactions (statistical methods) • Increase mechanistic understanding of reasons for change • Improving prediction and uncertainties (surges and waves) • Incorporate findings into inundation projections and coastal simulators • Encourage efforts to clean up historical hurricane data sets