Download

1 / 35
390 likes | 873 Views
Personal Diet Analysis. Foods, Facts & Fallacies YSCN 0006 http://web.hku.hk/~lramsden/fff.html. Diet Analysis. What is in our diet? What do we need from our diet? How do we know what we are eating?. Why Do We Eat?. Energy = supply of carbon Nitrogen, to build proteins

E N D
Personal Diet Analysis Foods, Facts & Fallacies YSCN 0006 http://web.hku.hk/~lramsden/fff.html
Diet Analysis • What is in our diet? • What do we need from our diet? • How do we know what we are eating?
Why Do We Eat? • Energy = supply of carbon • Nitrogen, to build proteins • Essential nutrients
Food Components • Carbohydrates • Proteins • Lipids • Vitamins • Minerals
Food Selection • Availability • Geographical factors • Economic factors • Instincts • Taste • Learned Behaviour • Cultural traditions
Increase Cheese Salmon Shell fish Beef Pork Chicken Salads Frozen vegetables Fresh fruit Chocolate biscuits Ice cream Coffee Decrease Tinned meat Sausages Herrings Margarine Lard Milk puddings Potatoes Dried beans Tinned vegetables White bread Oatmeal Tea Consumption in UK as Income Rises
Tastes • Sweetness Sugars • Bitterness Quinine • Sourness Acids • Saltiness Salts • Astringency Tannins, tea • Pungency Chilli • Umami Amino acids
What should we eat? • Standard Values (US system) of Dietary Reference Intakes • EAR ~ Estimated Average Intake. • Level of nutrient sufficient for 50% of population • RDA ~ Recommended Dietary Allowances • Level for 97% of population EAR x 1.2 • DV ~ Daily values • Based on RDA expressed on a daily basis for highest group in any category
How are RDA’s obtained? • Standards largely originated from military requirements during the World Wars • Trials with animals and human volunteers • Maintained on specific diets lacking a particular nutrient or at a limited level • Determine the quantity necessary to maintain good nutritional health • Increased to cover range of variation in population and provide a safety margin Generally 50% above average figure
RDA’s • Are Averages • Of requirements of whole populations in a particular category • Not necessary to consume RDA amounts on a daily basis as turnover varies. • Your requirements can differ from averages • Because of age, weight, physiology or genetics.
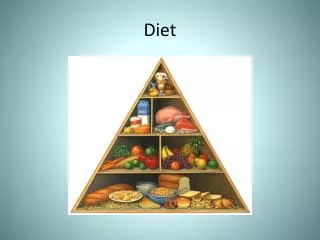
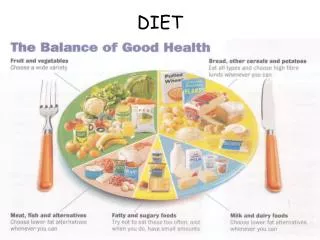
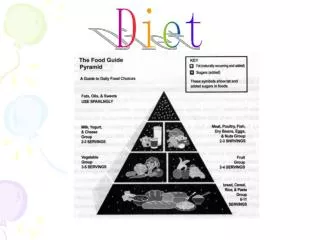
Dietary guidelines • Diet guidelines suggested by Govts. • Good Food Pyramid in USA • Easy to understand • Uses broad categories • Approximate amounts • Allows flexibility in food choice
What are the new Dietary Guidelines? • Science-based advice for ages 2+ Promote health, prevent chronic disease • Federal nutrition policy/programs • HHS/USDA – Legislated for every 5 yrs. • MyPyramid
Adequate Nutrients Within Calorie Needs Weight Management Physical Activity Food Groups To Encourage Fats Carbohydrates Sodium and Potassium Alcoholic Beverages Food Safety Nine Focus Areas
Adequate Nutrients Within Calorie Needs • Consume a variety of nutrient-dense foods and beverages within and among the basic food groups while choosing foods that limit intake of saturated and trans fat, cholesterol, added sugars, salt, and alcohol • DASH and FGS examples of healthy eating patterns
Physical Activity • Engage in regular physical activity and reduce sedentary activities to promote health, psychological well-being, and a health body weight • Achieve physical fitness by including cardiovascular conditioning, stretching, and resistance exercises. • Children and adolescents – At least 60 minutes on most, preferably all, days of the week.
New for 2005 • Specificity of recommendations • At least 30 minutes to reduce risk of chronic disease • Up to 60 minutes of moderate to vigorous physical activity may be needed to prevent gradual weight gain that occurs over time • 60 to 90 minutes of moderate-intensity physical activity to sustain weight loss • Recommendations for specific populations
Weight Management • To maintain body weight in a healthy range, balance calories from foods and beverages with calories expended. • To prevent gradual weight gain over time, make small decreases in food and beverage calories and increase physical activity
Food Groups To Encourage • Consume sufficient amts. of fruits & vegetables while staying within energy needs • For 2000 calories: 2 cups of fruit, 2½ cups of vegetables • Choose a variety of fruits and vegetables • Consume 3 oz. equivalents of whole grains daily—at least half whole grains (rest enriched) • Consume 3 cups per day of fat-free or low-fat milk or equivalent milk products
New for 2005 • Focus on cups instead of servings • Increase in amount from dairy group (3 cups) • Specific number recommended for whole grains • Foods groups identified with disease prevention • Specific recommendations for children and adolescents • At least half the grains should be whole grains • Children 2 to 8 years should consume 2 cups fat-free or low-fat milk or equivalent milk products
Fats • Consume less than 10 % of calories from saturated fatty acids, less than 300 mg/day of cholesterol and keep trans fatty acids as low as possible • Total fat between 20 to 35 % with most fats from sources of PUFAs and MUFAs, such as fish, nuts, and vegetable oils • Select and prepare meat, poultry, dry beans, and milk or milk products that are lean, low-fat, or fat-free • Limit intake of fats and oils high in saturated and/or trans fatty acids
New for 2005 • Focus on reducing trans and sat • Increase emphasis on MUFAs and PUFAs • Increase in range of total fat 20-35% (DRIs) • Specific recommendations for children and adolescents • Total fat between 30-35 % calories (2 to 3 yo) • Total fat between 25-35% calories (4 to 18 yo) with most fats coming from PUFAs and MUFAs such as fish, nuts and vegetable oils
Carbohydrates • Choose fiber-rich fruits, vegetables, and whole grains • Choose and prepare foods and beverages with little added sugars or caloric sweeteners, such as amounts suggested by the DASH eating plan and FGS • Consume sugar- and starch-containing foods and beverages less frequently to reduce caries
Sodium and Potassium • Consume < 2,300 mg (~1 tsp. salt) of sodium per day • Choose and prepare foods with little salt. At the same time, consume potassium-rich foods, such as fruits and vegetables.
Dietary guidelines • Aim to improve diets • Current USA energy intake vs. Guideline • Protein 15% 15% • Carbohydrate 46% 55% • Fat 38% 30%
Diet Analysis • Determine the composition of your diet • Does not require chemical analysis anymore • Food Reference tables • Use of diet analysis software • Built in database