Download
1 / 10
100 likes | 216 Views
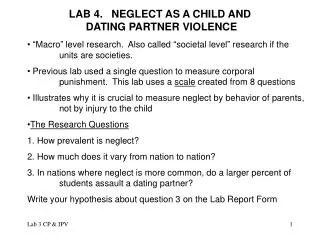
LAB 3. NATIONAL DIFFERENCES IN CORPORAL PUNISHMENT AND DATING PARTNER VIOLENCE. “Macro” level research. Also called “societal level” research if the units are societies. Compare to previous lab which used “Individual level” data

E N D
LAB 3. NATIONAL DIFFERENCES IN CORPORAL PUNISHMENT AND DATING PARTNER VIOLENCE • “Macro” level research. Also called “societal level” research if the units are societies. • Compare to previous lab which used “Individual level” data • Lab Projects from here on will use “macro” or societal level data • The Research Question • The same question as for previous lab, but at the social system level • Do nations where corporal punishment is used by many parents have a higher probability of students hitting a dating partner? • Write your hypothesis on the Lab Report Form
SAMPLE AND MEASURES • SAMPLE: • 26 Universities in 13 countries • INDEPENDENT VARIABLE = Corporal Punishment measured by asking Question 105. This is variable VS01 on the data sheets. • “When I was less then 12 years old, I was spanked or hit a lot by my mother or father.” • 1 = Strongly disagree • 2 = Disagree • 3 = Agree • 4 = Strongly Agree • DEPENDENT VARIABLE • Conflict Tactics Scales scores for Minor and Severe assaults on a dating partner in the past year. (next slide)
CONFLICT TACTICS SCALES – VIOLENCE SCALE QUESTIONS SPSS IDV NAMEQ # ASSAULT – MINOR CCAMS1 208 THREW SOMETHING AT PARTNER THAT COULD HURT CCAMS2 210 TWISTED MY PARTNER'S ARM OR HAIR CCAMS3 218 PUSHED OR SHOVED MY PARTNER CCAMS4 246 GRABBED MY PARTNER CCAMS5 254 SLAPPED MY PARTNER ASSAULT - SEVERE CCASS1 222 USED A KNIFE OR GUN ON MY PARTNER CCASS2 228 PUNCHED PARTNER OR HIT PARTNER WITH CCASS3 234 CHOKED MY PARTNER CCASS4 238 SLAMMED PARTNER AGAINST A WALL CCASS5 244 BEAT UP MY PARTNER CCASS6 262 BURNED OR SCALDED MY PARTNER PURPOSE CCASS7 274 I KICKED MY PARTNER
The X axis (horizontal axis) variable is the percent in each site who were “Spanked or hit a lot” before age 12. • Variable VS01_1 - row 3rd of the data sheet, next to last box • The Y axis (vertical axis) variable is the percent in each site who severely assaulted a dating partner. • Variable CTASSP_1 - row 1 of the data sheet, next to last box • Each of you will have a data sheet for one or two of the sites. • We will go around the class and each of you will read out the value for the X variable and then for the Y variable from your data sheet • As each pair of scores is read out, everyone will put a large dot in the cell of the table that corresponds to that combination of scores. SCATTER PLOT TO TEST THE HYPOTHESIS
FITTING A TREND LINE TO SHOW THERELATION BETWEEN THE PREVALENCE OF CORPORAL PUNISHMENT IN A COUNTRY AND THE PREVALENCE OF ASSAULTING A DATING PARTNER • Inspect the scatter plot to see if there there is a tendency for the percent who were violent to a partner to increase from the left to the right side of the chart. • If there is such a tendency, draw an trend line that shows by sliding a ruler over the chart to get the best fit • When this line is fitted mathematically it is called a “regression line” The computer will also give you a correlation or regression coefficient that indicates how good the fit is between the dots and the line. • Regression line when r = 1.00, r = .00, and r = .71 (next slide)
SPSS SCATTER PLOT Partial r controlling forsocial desirability and gender = .71, p >.001
RESULTS AND DISCUSSION SECTION OF THE LAB REPORT • RESULTS SECTION • How much corporal punishment was there? How much did it vary from university to university? • How much severe violence to partners was there? How much did it vary from university to university? • What is the relation of corporal punishment to hitting a dating partner? How close a relationship is there? • Anything else you noticed about the results? • DISCUSSION SECTION (answer either or both) • What processes could produces this relationship? • What do the results suggest concerning social policy?
TABLE 1: CHILDHOOD PHYSICAL VIOLENCE VICTIMIZATION Hit by Parents when Under the Age of 12 (vs01) Site % USA-LOUISIAN 68.6 MEX-JUAREZ 66.0 CAN-WINNIPEG 64.4 USA-MISSISSP 64.0 USA-CINCINN 63.4 HONGKONG 62.7 USA-TX-N MEX 62.5 KOR-PUSAN 58.8 CAN-HAMILTON 58.4 USA-UTAH 58.4 CAN-LONDON 57.2 NZL-CHRISTCH 55.2 USA-TX-MEX 54.4 CHE-FRENCH 51.9 USA-NH 2 49.3 USA-NH 1 44.0 CHE-GERMAN 35.2 CAN-MONTREAL 27.3 PRT-BRAGA 23.5 ISR-EMEKZYRL 22.8 BRA-SAOPAULO 19.6 NDL-AMSTRDAM 19.5 Hit by Parents When a Teenager (vs02) Site % HONGKONG 56.4 KOR-PUSAN 52.2 PRT-BRAGA 45.5 BRA-SAOPALO 40.0 USA-MISSISSP 37.8 USA-LOUISIAN 37.4 USA-TX-MEX 34.5 MEX-JUAREZ 30.1 CAN-HAMILTON 26.5 CAN-LONDON 26.4 USA-CINCINN 26.2 CAN-WINNIPEG 24.1 USA-TX-N MEX 23.4 CHE-FRENCH 20.4 CAN-MONTREAL 19.2 ISR-EMEKZYRL 19.2 NZL-CHRISTCH 17.2 USA-NH 1 16.8 USA-UTAH 16.8 CHE-GERMAN 16.8 USA-NH 2 16.1 NDL-AMSTRDAM 12.6 Hit by Non-Family Adults & Children as a Child (vs10) Site % HONGKONG 72.3 KOR-PUSAN 62.8 CHE-FRENCH 57.0 NDL-AMSTRDAM 46.6 MEX-JUAREZ 45.7 CAN-LONDON 42.1 PRT-BRAGA 39.5 NZL-CHRISTCH 38.1 USA-UTAH 37.2 USA-CINCINN 36.2 CAN-WINNIPEG 36.1 CAN-HAMILTON 35.8 USA-TX-MEX 35.4 USA-LOUISIAN 35.2 USA-NH 1 33.4 USA-TX-N MEX 32.2 USA-MISSISSP 30.6 BRA-SAOPAULO 30.4 USA-NH 2 29.0 CAN-MONTREAL 28.0 ISR-EMEKZYRL 27.1 CHE-GERMAN 21.5 Rank 1 2 3 4 5 6 7 8 9 10 11 12 13 14 15 16 17 18 19 20 21 22
WHAT HAS BEEN LEARNED FROM THIS LAB? • RESULTS • THE PREVALENCE OF CORPORAL PUNISHMENT WORLD-WIDE • THE PREVALENCE OF VIOLENCE AGAINST DATING PARTNERS BY UNIVERSITY STUDENTS WORLD-WIDE • WHETHER CORPORAL PUNISHMENT IS RELATED TO HOW VIOLENCE A COUNTRY IS • METHODS • HOW A SCATTER PLOT CAN BE USED TO TEST A HYPOTHESIS • AN UNDERSTANDING OF THE FOLLOWING RESEARCH TOOLS: • Regression line • Correlation or regression coefficient • Test of significance • AN EXPERIENCE WITH EVALUATING DATA AND INTERPRETING RESULTS