Download
1 / 23
230 likes | 337 Views
Integrating Parallel Computing Performance Tools with Performance Cockpit. Tianchao Li (lit@in.tum.de) Michael Gerndt (gerndt@in.tum.de) Munich University of Technology, Germany. Performance Analysis Tools for Parallel Computing.

E N D
Integrating Parallel Computing Performance Tools with Performance Cockpit Tianchao Li (lit@in.tum.de) Michael Gerndt (gerndt@in.tum.de) Munich University of Technology, Germany
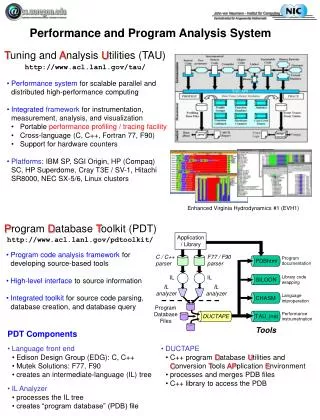
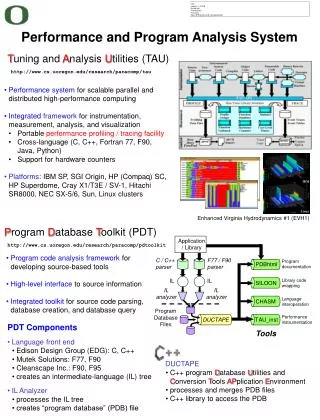
Performance Analysis Tools for Parallel Computing • Monitor program execution and produce performance data that are analyzed to locate and understand performance problems • Many tools vary in • Programming Languages & Programming Paradigms • Source instrumentation vs. binary instrumentation • Profiling vs. Tracing • Full monitoring vs. selective monitoring • Post-mortem analysis vs. run-time analysis • …
Tr P n-1 Trace P1 Trace P0 Tracing Recording performance data of individual events ... Function Obelix (...) call monitor(“Obelix“, “enter“) ... call MPI_send(…) call monitor(“Obelix“,“exit“)end Obelix ... Process 0 Process 1 MPI Library Function MPI_send (...) call monitor(“MPI_send“, “enter“) ... call monitor(“MPI_send“,“exit“)end Obelix ... Process n-1
10 200 Profiling Recording accumulated performance data for events CPU ... Function Obelix (...) call monitor(“Obelix“, “enter“) ... call monitor(“Obelix“,“exit“)end Obelix ... cache miss counter monitor(routine, location) if (“enter“) then else end if Function Table Main Asterix 1300 Obelix 1490 1490 + - 1300 10
GUIs for Parallel Performance Tools • Typically, each performance tool provides a customized UI • show application structure • specify measurement targets • control measurement execution • display measurement result • Diversity of UI brings many drawbacks • inconsistent user interface • difficult to learn • bad user experience • hard to integrate and interoperate • Duplicate work on common features • We need a common GUI platform
Performance Cockpit • Integrate existing performance tools • Code instrumentation • Performance monitoring • Visualization • Originated from academic research project EP-Cache • Efficient Parallel Programming of Cache Architectures • Performance measurement tools developed, including • Counter-based Profiling and Tracing Environment (CPTE) • EP-Cache Monitor (EPCM)
CPTE Plug-in EPCM Plug-in Instrumentation Plug-ins Instrumentation Plug-ins Example Plug-ins Performance Platform Eclipse + CDT + Fortran Plug-in The General Extensible Architecture
The Standardized Intermediate Representation • Standardized representation should be defined for all relevant information • program code region structure • program instrumentation targets and/or monitoring requests • measured performance data • Standardized Intermediate Representation (SIR) • standardized abstract representation of program structure • Fortran 95, Java, C and C++ • defined in the APART working group
Status and Future Developments • Major development activity ceased after the EP-Cache project • Adopted by other academic project (Periscope) • other performance tools • automatic performance analysis • Integration with PTP • Integration with TPTP
Status and Future Developments • Major development activity ceased after the EP-Cache project • Adopted by other academic project (Periscope) • other performance tools • automatic performance analysis • Integration with PTP • Integration with TPTP
Seeking Career Opportunities • PhD candidate and full-time research associate in TUM • 5 year experiences in software development (Worksoft, TUM, IBM, BMW) • 3 years experience with Eclipse plug-in development • IBM Intelligent Miner Solution Framework Application Generator • Performance Cockpit • Grid Service Development Environment • Hosting a practical course for Eclipse Plug-in Development (SS05, WS0506), which was awarded the IBM Innovation Grant • PhD supported by IBM Center of Advanced Studies – Automated Resource Management for Large-Scale Grid • Email: lit@cs.tum.edu