Download

1 / 11
110 likes | 207 Views
Second Derivative Test, Graphical Connections. Section 4.3b. Do Now: #30 on p.204 (solve graphically). (a) Local Maximum at. (b) Local Minimum at. (c) Points of Inflection:. Second Derivative Test for Local Extrema. If and , then has a

E N D
Second Derivative Test, Graphical Connections Section 4.3b
Do Now: #30 on p.204 (solve graphically) (a) Local Maximum at (b) Local Minimum at (c) Points of Inflection:
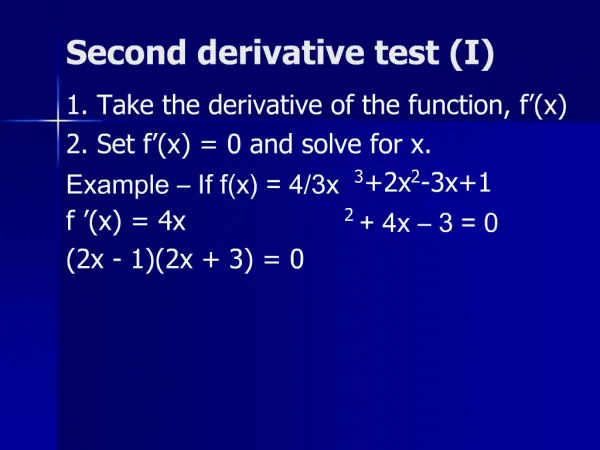
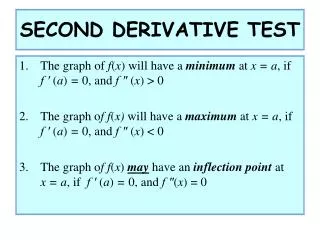
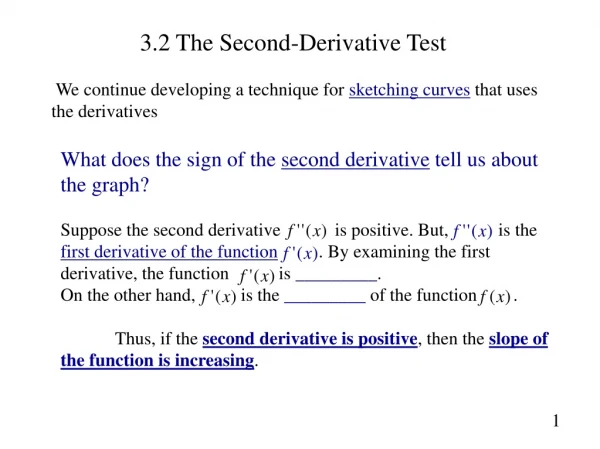
Second Derivative Test for Local Extrema If and , then has a local maximum at x = c. 2. If and , then has a local minimum at x = c. Let’s see these with the graphs of the squaring function and the negative squaring function…
Another Quick Example Find the extreme values of Critical Points??? x = 2, –2 has a local min. at x = 2 has a local max. at x = –2 Support our answers graphically???
Let 1. Identify where the extrema of occur. 2. Find the intervals on which is increasing and the intervals on which is decreasing. 3. Find where the graph of is concave up and where it is concave down. 4. Sketch a possible graph for .
Let is continuous since exists. The domain of is all reals, so the domain of is the same. Thus, the critical points of occur only at the zeros of . CP at x = 0, 3 Intervals x < 0 0 < x < 3 x > 3 – – + Sign of Behavior of Dec. Dec. Inc. Use first derivative test: Local Min. at x = 3 Decreasing on , Increasing on
Let The zeros of (IP) are at x= 0, 2 Intervals x < 0 0 < x < 2 x > 2 + – + Sign of Behavior of Conc. up Conc. down Conc. up Concave up on , Concave down on
Let Summarizing info. from both tables: x < 0 0 < x < 2 2 < x < 3 x > 3 Decreasing Decreasing Decreasing Increasing Concave up Concave down Concave up Concave up One possibility for the graph of : x = 0 x = 2 x = 3
Let Note: We are able to recover almost everything about a differentiable function by examining its first derivative… We cannot determine how to place the graph in the x-y plane (vertically) to position the graph we would need only the value of at one point!!! One possibility for the graph of : x = 0 x = 2 x = 3
A function is continuous on , , , and derivatives have the following properties: x –2 < x < 0 x = 0 0 < x < 2 x = 2 2 < x < 4 – – + does not exist 0 – + + does not exist 0 1. Find where all absolute extrema of occur. 2. Find where the points of inflection of occur. 3. Sketch a possible graph of .
A function is continuous on , , , and derivatives have the following properties: x –2 < x < 0 x = 0 0 < x < 2 x = 2 2 < x < 4 – – + does not exist 0 – + + does not exist 0 Absolute Maximum occurs at x = 0 (cannot determine its value) Absolute Minimum of 1 at x = 4 Point of Inflection at x = 2