Download
1 / 17
200 likes | 438 Views
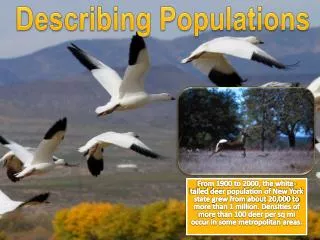
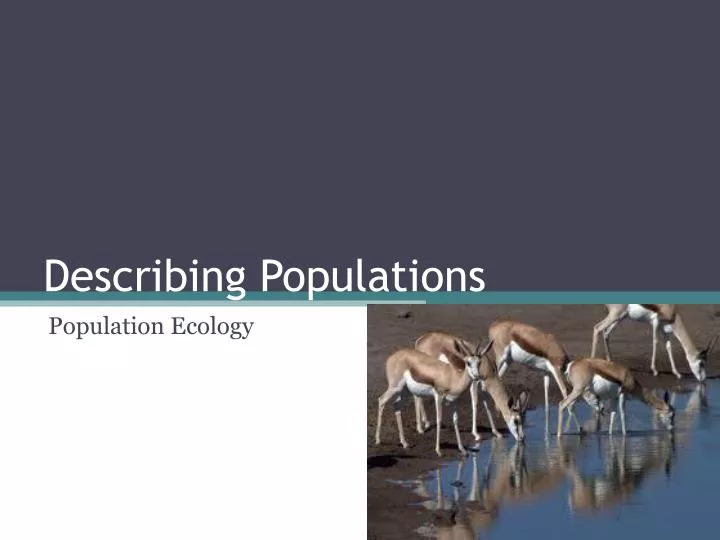
Describing Populations. Population Ecology. POPULATION. Individuals of the same species living in a particular area Population size, density, distribution and age structure can help the ecologist understand how a population may grow or decline. POPULATION SIZE.

E N D
Describing Populations Population Ecology
POPULATION • Individuals of the same species living in a particular area • Population size, density, distribution and age structure can help the ecologist understand how a population may grow or decline
POPULATION SIZE • The overall health of a population can often be monitored by tracking how its size changes • POPULATION SIZE– Describes the number of individual organisms present in a given population at a given time • Population size may increase, decrease, undergo cyclic change, or remain the same over time.
The Decline of the Passenger Pigeon • Shows extremes of population size • Once most abundant bird in North America • Huge flocks darkened skies. • In 1800’s 2 billion formed a near solid mass 240 miles long and took 5 hours to fly overhead…sounded like a tornado! • Passenger pigeons nested and bred in forests. • Forests cut down and hunted. Shipped to market as food 1898 Photograph of a Passenger Pigeon.The last wild Passenger Pigeon was shot by a 14-year-old boy in Ohio in 1900, while the last known individual of the passenger pigeon species, named "Martha" after Martha Washington, died at 1 p.m. on the 1st of September 1914 in the Cincinnati Zoological Garden. She was 29.
Passenger Pigeons, Continued By end of 1800s the population was so small the pigeons could not form needed colonies to breed. Last passenger pigeon on Earth died in the Cincinatti Zoo in 1914
DETERMINING POPULATION SIZE • Were 2 billion pigeons actually “counted?” • Probably not—sometimes not possible • Population size is estimated using sampling techniques • We will be using a sampling technique later today in our lab!
POPULATION DENSITY • Measure of “how crowded” an area is • Number of individuals within a population per unit time • Example: 1500 golden toads counted in 1987 within 4 square kilometers • Population density = 1500toads/4 square km = 375 toads/square km • In general, larger organisms like lions have lower population densities because they require more resources and room to survive
Different Densities • High population density can make it easier for organisms to group together and find mates but can also lead to conflict/competition • Overcrowded = more vulnerable to predators = increase transmission of disease • Low density = may benefit from more space and resources, but harder to mate
DENSITY AND THE HARLEQUIN FROG • Lived in very specific locations called “splash zones” in Costa Rica • Spash zone= area alongside rivers and streams that receive spray from waterfalls and rapids • 1980s and ‘90s Montverde region of Costa Rica got warmer and drier water flow decreased and streams dried up • Few splash zones left • Frog densities up to 4.4x higher than normal around remaining splash zones
DENSITY AND THE HARLEQUIN FROG • Overcrowding= disease transmission = predator attack = assault from parasitic flies • Harlequin frog disappeared from Monteverde region but a few exist elsewhere
POPULATION DISTRIBUTION • How individuals are arranged in an area • Sometimes called population DISPERSION • Three types: random, uniform and clumped
RANDOM DISTRIBUTION • Individuals are arranged within a space in no particular pattern • Found where resources needed are found throughout an area
UNIFORM DISTRIBUTION • Individuals evenly spaced throughout an area • When individuals hold territory or compete for space
CLUMPED DISTRIBUTION • Individual organisms arrange themselves according to the availability of resources needed to survive • Most common in nature • Examples: Desert animals live in patches around isolated sources of water • Harlequin Frogs around splash zones • Humans by urban centers • Ants living in colonies
AGE STRUCTURE • Describes relative numbers of organisms of each age in a population (also known as age distribution) • Age pyramids/age structure diagrams– visual tools used to show age structure of population • Can be useful for predicting population growth
SEX RATIOS • Proportion of males to females • Age structure diagrams can give this information • 50:50 ratio ideal, otherwise harder for any individual to reproduce and pass on genes