Download

1 / 20
200 likes | 354 Views
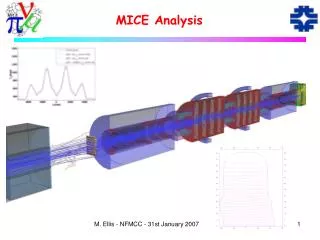
MICE Software and Analysis. Diffuser. Cooling channel. D1. D2. Q1. Q2. Q3. Q4. Q5. Q6. Q7. Q8. Q9. DK sol. Target. GVA1. BPM1. TOF0. TOF1. TOF2. Mark Rayner, The University of Oxford

E N D
MICE Software and Analysis Diffuser Cooling channel D1 D2 Q1 Q2 Q3 Q4 Q5 Q6 Q7 Q8 Q9 DK sol Target GVA1 BPM1 TOF0 TOF1 TOF2 Mark Rayner, The University of Oxford Muon accelerators for particle physics and MICE 22nd June 2010, Rutherford Appleton Laboratory MICE software and analysis
Introduction Initial 4D eN (mm) 3 6 10 Absorber pz (MeV/c) 140 200 240 Data taking in December 1 2 t a, b Diffuser e • Purpose of the beam line: • Generate the emittance-momentum matrix elements in pion muon decay beam lines • Phase space reconstruction by TOF0 and TOF1 • Longitudinal momentum resolution O(5 MeV/c) • Transverse position resolution O(2 cm) • Transverse momentum resolution O(pxmax/70) • Dependent on pxmax, the maximum un-scraped momentum of the optics in question • The 6-200 element has been simulated using G4BeamLine and G4MICE MICE software and analysis
6D phase space upstream of the cooling channel t pz x px y py t pz Spread in time Defined by TOF measurements of extrapolated RF phase Longitudinal- transverse coupling Matches the beam in the RF x px y Transverse phase space Measured upstream and downstream by the scintillating fibre trackers py Dispersion Relevant for future 6D cooling investigations LiH wedge absorbers etc… MICE software and analysis
Talk plan • Phase space reconstruction procedure • Monte Carlo comparison • Transverse phase space of the data • Dispersion of the data • Beam line performance • Simulation of the data through a Stage 6 cooling channel MICE software and analysis
Selection of the muon peak 6-200 Intermediate momentum 6-140 MICE software and analysis
Reconstruction procedure Track through through each quad, and calculate s»leff + dF + dD Assume the path length S»zTOF1 – zTOF0 zTOF1 – zTOF0 = 8 m Estimate the momentum p/E = S/Dt Add up the total path S = s7 + s8 + s9 + drifts Calculate the transfer matrix Deduce (x’, y’) at TOF0 from (x, y) at TOF1 Deduce (x’, y’) at TOF1 from (x, y) at TOF0 MICE software and analysis
Momentum reconstruction: 6-200 simulation Path length ! Measuring path length removes the bias on the momentum measurement MICE software and analysis
Simulation/data comparison at TOF1 (6-200 matrix element) Muon momentum Muon time of flight This simulation uses the geometry from before TOF1 was moved Dz = – 16.7 cm = – 0.56 ns / c MICE software and analysis
Trace space comparison with Monte Carlo at TOF1 MICE software and analysis
6-140 (x, px, y, py, pz) in mm and MeV/c x RMS normalized phase emittance = 5.30 mm y RMS normalized phase emittance = 1.78 mm Transverse 4d RMS normalized phase emittance = 3.07 mm Covariance matrix 4296 -509.0 132.3 -20.37 5.77 4451 -5.34 1.32 168.8 15.13 -438.7 55.8 -7.03 13.65 1286 30.08 -8.49 14.085 0.136 212.8 Means MICE software and analysis
6-200 (x, px, y, py, pz) in mm and MeV/c x RMS normalized phase emittance = 5.37 mm y RMS normalized phase emittance = 2.25 mm Transverse 4d RMS normalized phase emittance = 3.48 mm Covariance matrix 3359 -610.0 205.8 18.99 -17.68 3600 1.17 -1.61 82.3 17.43 -107.6 -5.0 -5.84 11.81 602 16.64 -12.09 15.311 -0.407 258.1 Means MICE software and analysis
x:px, y:py and pz for 6-140 and 6-200 6-140 6-200 6-140 3s fit 6-200 6-140 6-200 MICE software and analysis
Horizontal spatial dispersion 6-140 6-140 6-200 6-200 MICE software and analysis
Horizontal momentum dispersion 6-140 6-140 6-200 6-200 MICE software and analysis
Vertical spatial dispersion 6-140 6-140 6-200 6-200 MICE software and analysis
Vertical momentum dispersion 6-140 6-140 6-200 6-200 MICE software and analysis
Beam line performance Emittances and Twiss parameters extrapolated to the diffuser faces. MICE software and analysis
Comparison of matched and measured simulated input beams eN (mm) G4MICE Geant4 Monte Carlo MICE software and analysis
Next step: matching longitudinal phase space Ideal cooling demonstration 1 Build one lattice element and treat it as a black box 2 Spectrometers – measure (x, px, y, py, t, pz) 3 A Neutrino Factory beam 10 MV/m 90 degrees 15 MV/m 40 degrees MICE software and analysis
Conclusion • 5D phase space has been measured upstream by TOF0 and TOF1 • Encouraging agreement with Monte Carlo • In principle, re-weighting may be necessary in order to accurately match the transverse phase space of a muon beam in the solenoidal channel • However, simulations based on the first measurements of the MICE muon beam indicate that cooling will be observed even on a raw beam • Therefore, only relatively minor transverse beam selection/re-weighting should be needed • The beam line has been designed rather well MICE software and analysis In order to match the longitudinal phase space of the beam in the RF cavities, it will be necessary to extrapolate a 50 ps timing measurement into the lattice and select 90 degree peak accelerated muons. 105 of these ‘good’ muons will be required to make a 1% measurement of the fractional emittance reduction of a 6 mm beam. (Taking account of the correlated initial and final phase spaces.)