Download
1 / 7
70 likes | 153 Views
A. B. Tibia Shaft. Spleen. Male. Female. *. 40. 1.2. 30. 1.2. 30. Relative RANKL gDNA. 20. 0.8. 0.8. Body weight change (%). 20. 10. 10. 0.4. 0.4. 0. 0. 0.0. 0.0. -10. -10. RANKLf/f. RANKLf/f. RANKL ∆ot. RANKLf/f. RANKL ∆ot. RANKL ∆ot. Control diet. Female.

E N D
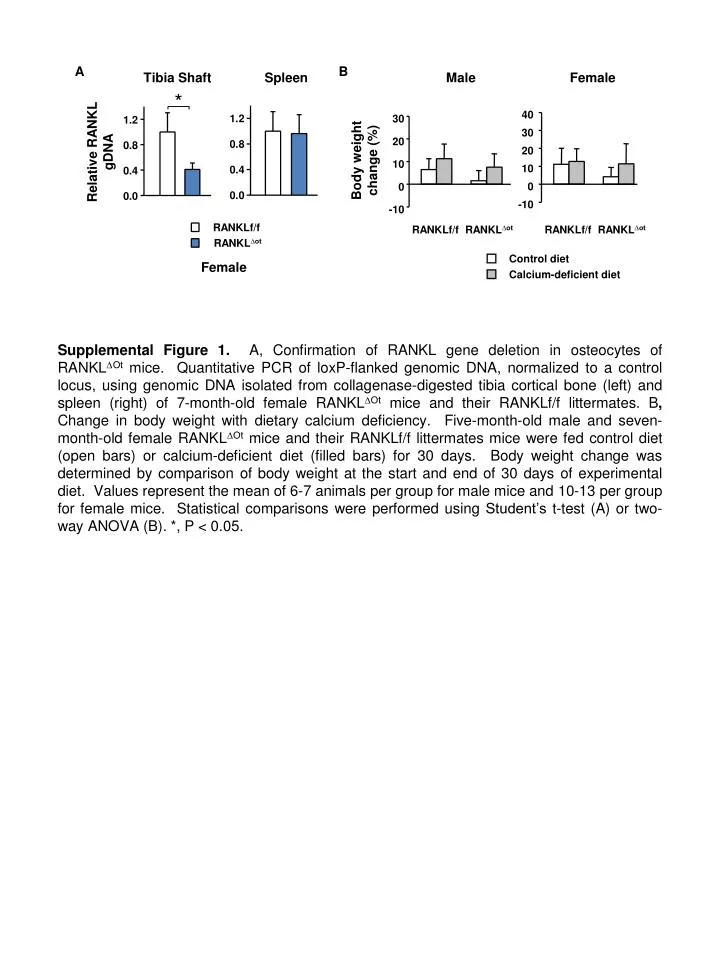
A B Tibia Shaft Spleen Male Female * 40 1.2 30 1.2 30 Relative RANKL gDNA 20 0.8 0.8 Body weight change (%) 20 10 10 0.4 0.4 0 0 0.0 0.0 -10 -10 RANKLf/f RANKLf/f RANKL∆ot RANKLf/f RANKL∆ot RANKL∆ot Control diet Female Calcium-deficient diet Supplemental Figure 1. A, Confirmation of RANKL gene deletion in osteocytes of RANKL∆Ot mice. Quantitative PCR of loxP-flanked genomic DNA, normalized to a control locus, using genomic DNA isolated from collagenase-digested tibia cortical bone (left) and spleen (right) of 7-month-old female RANKL∆Ot mice and their RANKLf/f littermates. B, Change in body weight with dietary calcium deficiency. Five-month-old male and seven-month-old female RANKL∆Ot mice and their RANKLf/f littermates mice were fed control diet (open bars) or calcium-deficient diet (filled bars) for 30 days. Body weight change was determined by comparison of body weight at the start and end of 30 days of experimental diet. Values represent the mean of 6-7 animals per group for male mice and 10-13 per group for female mice. Statistical comparisons were performed using Student’s t-test (A) or two-way ANOVA (B). *, P < 0.05.
Day 0 Con: Control diet Day 30 Cal-def: Calcium-deficient diet A Femur Spine Total body 0.10 0.12 0.10 * * 0.08 0.08 0.08 0.06 0.06 g/cm2 0.04 0.04 0.04 0.02 0.02 0.00 0.00 0.00 Con Cal-def Con Cal-def Con Cal-def Con Cal-def Con Cal-def Con Cal-def RANKLf/f RANKL∆ot RANKLf/f RANKL∆ot RANKLf/f RANKL∆ot B Spine Femur Total body 0.10 0.12 0.16 * * 0.08 0.12 0.08 0.06 g/cm2 0.08 0.04 0.04 0.04 0.02 0.00 0.00 0.00 Con Cal-def Con Cal-def Con Cal-def Con Cal-def Con Cal-def Con Cal-def RANKLf/f RANKL∆ot RANKLf/f RANKL∆ot RANKLf/f RANKL∆ot Supplemental Figure 2. Deletion of RANKL in Dmp1-Cre expressing cells blunts the bone loss associated with dietary calcium deficiency. Five-month-old male and 7-month-old female RANKL∆Ot mice and their RANKLf/f littermates were fed control diet (Con) or calcium-deficient diet (Cal-def) for 30 days. A, BMD in the spine (left), femur (center), and total body (right) of 5-month-old male mice were measured at the start and end of 30 days of experimental diet. Values represent the mean of 6-7 animals per group. B, BMD in the spine (left), femur (center), and total body (right) of 7-month-old female mice were measured at the start and end of 30 days of experimental diet. Values represent the mean of 10-13 animals per group. All statistical comparisons were performed using Student’s t-test. *, P < 0.05.
Control diet Calcium-deficient diet Tt.Ar Ct.Ar Ct.Ar/Tt.Ar * * A * * 3.0 1.6 0.6 1.2 2.0 0.4 mm2 mm2 0.8 1.0 0.2 0.4 0.0 0.0 0.0 RANKLf/f RANKL∆ot RANKLf/f RANKL∆ot RANKLf/f RANKL∆ot Tt.Ar Ct.Ar Ct.Ar/Tt.Ar B * * * * 3.0 0.8 1.6 0.6 2.0 1.2 mm2 mm2 0.4 0.8 1.0 0.2 0.4 0.0 0.0 0.0 RANKLf/f RANKL∆ot RANKLf/f RANKL∆ot RANKLf/f RANKL∆ot C Femur length 20 16 12 mm 8 4 0 RANKLf/f RANKL∆ot Supplemental Figure 3. Deletion of RANKL in Dmp1-Cre expressing cells blunts the cortical bone loss associated with dietary calcium deficiency. Five-month-old male and 7-month-old female RANKL∆Ot mice and their control littermates (RANKLf/f) were fed control diet (open bars) or calcium-deficient diet (filled bars) for 30 days. A-B, Micro-CT analysis of cortical total cross-sectional area (Tt.Ar), cortical bone area (Ct.Ar), and cortical area fraction (Ct.Ar/Tt.Ar) in the midshaft of femur of 5-month-old male mice (A) and 7-month-old female mice (B). C, Femur length of female mice. Values represent the mean of 6-7 animals per group for male mice and 10-13 animals per group for female mice. All statistical comparisons were performed using two-way ANOVA. *, P < 0.05.
Control diet Calcium-deficient diet Material density (mg/cm3) BV/TV Tb.Th (mm) Tb.N Tb.Sp (mm) A * * * * * * * * 0.20 1.0 0.30 10 1200 0.15 0.8 8 0.20 800 0.6 0.10 Vertebra 6 0.4 4 0.10 400 0.05 0.2 2 0.00 0.0 0.00 0 0 RANKLf/f RANKL∆ot RANKLf/f RANKL∆ot RANKLf/f RANKL∆ot RANKLf/f RANKL∆ot RANKLf/f RANKL∆ot * * * * B * * * * 0.20 0.4 10 1200 0.8 8 0.15 0.3 800 6 Distal femur 0.10 0.2 0.4 4 400 0.05 0.1 2 0.00 0.0 0.0 0 0 RANKLf/f RANKL∆ot RANKLf/f RANKL∆ot RANKLf/f RANKL∆ot RANKLf/f RANKL∆ot RANKLf/f RANKL∆ot * * * * * C * * * * * * 1.0 10 0.4 0.4 1200 0.8 8 0.3 0.3 0.6 6 800 Vertebra 0.2 0.2 0.4 4 400 0.1 0.1 0.2 2 0 0 0.0 0.0 0.0 RANKLf/f RANKL∆ot RANKLf/f RANKL∆ot RANKLf/f RANKL∆ot RANKLf/f RANKL∆ot RANKLf/f RANKL∆ot * * * * * D * * * * * 1.2 0.4 10 0.6 1200 8 0.3 0.8 0.4 6 Distal femur 800 0.2 4 0.4 0.2 400 0.1 2 0.0 0.0 0 0.0 0 RANKLf/f RANKL∆ot RANKLf/f RANKL∆ot RANKLf/f RANKL∆ot RANKLf/f RANKL∆ot RANKLf/f RANKL∆ot Supplemental Figure 4. Cancellous bone mass and architecture did not change with dietary calcium deficiency. Micro-CT analysis of cancellous bone volume over tissue volume (BV/TV), trabecular thickness (Tb.Th), trabecular number (Tb.N), trabecular separation (Tb.Sp), and material density of L4 vertebra (A and C) and distal femur (B and D) in 5-month-old male (A and B) and 7-month-old female (C and D) RANKLf/f and RANKL∆Ot mice fed control diet (open bars) or calcium-deficient diet (filled bars) for 30 days. Values represent the mean of 6-7 animals per group for male mice and 10-13 animals per group for female mice. All statistical comparisons were performed using two-way ANOVA. *, P < 0.05.
Control diet Calcium-deficient diet Circulating RANKL 400 300 pg/ml 200 100 0 RANKLf/f RANKL∆ot Supplemental Figure 5. Circulating RANKL did not change with dietary calcium deficiency in 7-month-old female mice. Circulating RANKL measured in 7-month-old RANKL∆Ot mice and their RANKLf/f littermates fed control diet (open bars) or calcium-deficient diet (filled bars) for 30 days. Values represent the mean of 7-9 animals per group. Statistical comparison was performed using two-way ANOVA.
Control diet Calcium-deficient diet Tibia shaft L5 A * * * * 300 120 * 80 200 TRAP mRNA 40 100 0 0 B * * * * 16 60 * 12 40 CtsK mRNA 8 20 4 0 0 C 1.0 1.2 0.8 0.6 0.8 M-CSF mRNA 0.4 0.4 0.2 0.0 0.0 D 1.6 5 1.2 4 3 OPG mRNA 0.8 2 0.4 1 0.0 0 E * * 0.06 0.4 0.3 0.04 IL-6 mRNA 0.2 0.02 0.1 0.00 0.0 RANKLf/f RANKL∆ot RANKLf/f RANKL∆ot Supplemental Figure 6. Deletion of RANKL in Dmp1-Cre expressing cells blunts the increase of osteoclast-specific gene expression caused by dietary calcium deficiency. A, Quantitative RT-PCR of TRAP (A), Cathepsin K (CtsK) (B), M-CSF (C), OPG (D), and IL-6 (E) mRNA in tibia shafts with bone marrow flushed and L5 vertebrae of 5-month-old male RANKL∆Ot mice and their RANKLf/f littermates fed control diet (open bars) or calcium-deficient diet (filled bars) for 30 days. Values represent the mean of 6-7 animals per group. All statistical comparisons were performed using two-way ANOVA. *, P < 0.05.
Control diet Calcium-deficient diet Oc.N/B.Pm Oc.Pm/B.Pm * * * * * * 10 30 8 6 /mm % 20 4 10 2 0 0 RANKLf/f RANKL∆ot RANKLf/f RANKL∆ot Supplemental Figure 7. Deletion of RANKL in Dmp1-Cre expressing cells blunts the increase of osteoclasts caused by dietary calcium deficiency. Histomorphometric analysis of osteoclast number per bone perimeter (Oc.N/B.Pm) and osteoclast perimeter per bone perimeter (Oc.Pm/B.Pm) in cancellous bone of lumbar vertebra (n = 5 animals per group of 5-month-old male mice). All statistical comparisons were performed using two-way ANOVA. *, P < 0.05.