Download
1 / 18
180 likes | 306 Views
The Promise of Charter Schools for Improving Student Achievement. Darren Woodruff, PhD. Presentation Overview:. C harter authorizers and charter school boards need clear systems for evaluating and ensuring charter school quality.

E N D
The Promise of Charter Schools for Improving Student Achievement • Darren Woodruff, PhD
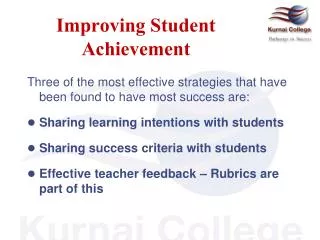
Presentation Overview: • Charter authorizers andcharter school boards need clear systems for evaluating and ensuring charter school quality. • This presentation will discuss the use of performance frameworks to support effective school oversight and high quality outcomes for all students GOALS: • Understand and discuss the academic components of charter school accountability • Discuss consequences and supports for high, middle, and low-performing charters
Good News!!!More Students Are Graduating . . . “When I take the court for the NBA Celebrity All-Star Game, I’ll be wearing a number that signifies some great news—thanks to the hard work of our nation’s students, parents, and educators. That number—80 percent—is the newly announced high school graduation rate, the highest in American history. Never before have 4 out of 5 American students completed high school.” --U.S. Secretary of Education Arne Duncanwww.youtube.com/watch?v=1UPpURcIIK4&feature=player_embedded#t=0
South Carolina High School Graduation RatesThe on-time statewide graduation rateincreased from 73.6% in 2010–2011 to 77.5% in 2012–2013.Largest two-year increase ever. 2010–2011 2012–2013Male 68.7% 73.2%Female 78.5% 82.0%African-American 69.7% 74.5%Hispanic 68.5% 73.2%Subsidized meals 67.0% 70.4%Disabled 38.4% 43.1%Limited English Proficiency 62.1% 68.2% Source: South Carolina Department of Education, High School Four-Year Cohort Graduation Rate, 2012–13 School Year (http://ed.sc.gov/agency/slice/documents/STUDENTPERFORMANCE-GraduationRate.pdf)
Nationally, only 12% of low-income high school graduates go on to earn a four-year college degree.-- National Alliance for Public Charter Schools
National Overview: Growth and Closure • Over 600 new public charter schools opened for the 2013–2014 school year. An estimated 288,000 additional students are attending public charter schools in SY 2013. • There are now approximately 6,400 public charter schools enrolling over 2.5 million students. This represents 7% growth in charter schools and 13% growth in student enrollment. • 200 public charter schools that were open in 2012–2013 closed. Closure was for reasons including low enrollment, financial concerns, and low academic performance. • In South Carolina, seven charters opened in 2013 and four closed (59 total). This represents a 10.9% growth in students to 22,384. Source: 2014 National Alliance for Public Charter Schools Report (http://www.publiccharters.org/wp-content/uploads/2014/02/New-and-Closed-Report-February-20141.pdf)
The Work of aCharter School Authorizer Board • The DC Public Charter School Board’s mission is to provide high quality public school options for District of Columbia students and families by conducting: • Comprehensive Application Review Process • Effective Oversight • Meaningful Support • Active Engagement of Stakeholders • Source: www.dcpcsb.org
Charter School Growth in DC: • 60 charter schools operating on 109 campuses. • Over 36,000 students (44% of the public school population) • Schools vary in size, location, and type, such as: • Early Childhood - three and four-year-olds • Traditional K – 12th grade • Adult learners: GED, Career and Technical Certification, English Language Skills, etc. • Disengaged youth (16-24) who are re-engaging in school • Sector serves a higher percentage (72%) of low-income students than traditional public schools in DC
District of Columbia High School Graduation Rates Source: http://osse.dc.gov/publication/2012-2013-adjusted-cohort-graduation-rate
Academic Indicators Performance Management Framework: How We Monitor for Academic Quality Source: www.dcpcsb.org/Oversight/PMF-Results.aspx
School Performance Consequences • Tier 1 – High-Performing Schools • Exempt from additional academic oversight • Recognition of their performance through public communication • Tier 2 – Mid-Performing Schools • Exempt from additional academic oversight • No specific consequences or interventions, but there may be specific recommended support asneeded. • Tier 3 – Low-Performing Schools • Increased on-site academic oversight • Charter Warning • Schools can be placed on Charter Warning due to academic or non-academic issues. • Charter Warning due to academics will be based: • Severity: Schools scoring 20% or below in the most recent year • Trajectory: Schools in Tier 3 showing ≥ 5 percentage point decrease in report card score from one year to the next • Duration:Schools performing in Tier 3 for 3 of 5 years • A Charter Warning requires Board reviewand can result in probation or charter revocation.
Tier 1: How do we grow more seats in high-performing schools? • Replicate campuses • Expand grade levels up or down • Recruit “Tier 1 on Day 1” CMOs and schools from other urban areas • Help with facilities • Fast track for approvals • Reduced oversight
Tier 2: How can we help schools improve and become high performers? • Support an ecosystem of Charter Support Organizations • State funding of third-party support organizations • Advocate with the funding community and the city for more resources • Make accountability transparent • Make targets attainable and clearly articulated • Engage in honest discussion about school’s performance • Have clear, direct performance discussions with schools • Facilitate partnerships and mergers • Provide qualitative and quantitative feedback
Tier 3: How do we expedite school closures that are minimally disruptive to students? • 200 public charter schools that were open in 2012–2013 closed. How did the process work? • Be aggressive about closing low-performing schools that areTier 3 for 3 years, as well as other low-performing schools (including low Tier 2) who are up for 5, 10, or 15 year reviews and have not met their goals • Facilitate charter takeovers to minimize disruptions to students • Have honest discussions with school board members about the likelihood of the school improving
For Your Consideration: What does “greater accountability” look like? • What academic indicator(s) causes schools to move up or down? • How are the schools with higher populations of “at-risk” students performing? • Why is it important to measure growth? • Are we rewarding schools who are “moving kids out”? • How does having a strong school culture (evidenced by mission, discipline policy, re-enrollment and attendance rates) affect performance?
References • 2014 National Alliance for Public Charter Schools Report (http://www.publiccharters.org/wp-content/uploads/2014/02/New-and-Closed-Report-February-20141.pdf) • DC High School Graduation Rates: http://osse.dc.gov/publication/2012-2013-adjusted-cohort-graduation-rate • DC Public Charter School Board, Performance Management Framework: www.dcpcsb.org/Oversight/PMF-Results.aspx • Secretary of Education: “Why I Wear 80”: http://www.huffingtonpost.com/arne-duncan/why-i-wear-80_b_4788503.html?utm_hp_ref=education&ir=Education • South Carolina Department of Education, High School Four-Year Cohort Graduation Rate, 2012–13 School Year, http://ed.sc.gov/agency/slice/documents/STUDENTPERFORMANCE-GraduationRate.pdf
THANK YOU!!! Contact Info: Darren Woodruff, PhD American Institutes for Research/Southeast Comprehensive Center (SECC) Partner Email: dwoodruff@air.org Phone: 202-403-5378