Download
1 / 28
280 likes | 417 Views
Project 4 - aims. GOAL Advance the development of DOI to improve image accuracy, repeatability, CNR, and depth sensitivity. AIM 1 – Instrumentation Continuous-wave and Time-Domain AIM 2 – Signal Processing Algorithms to filter signal clutter AIM 3 – Experiments to quantify improvements

E N D
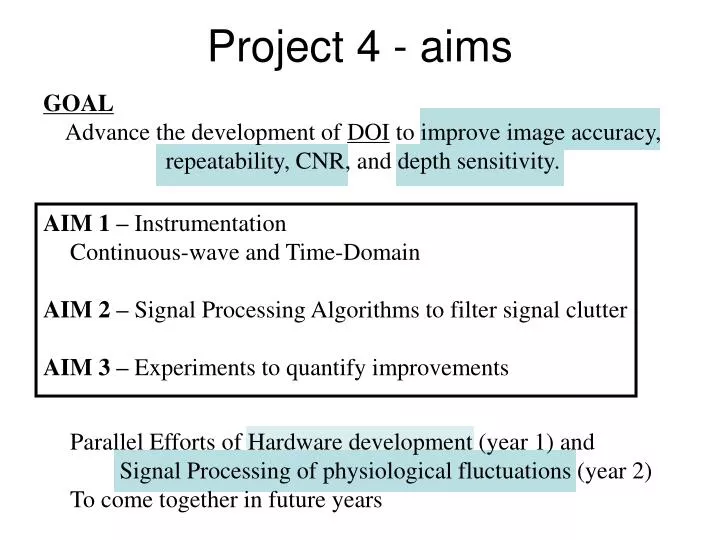
Project 4 - aims GOAL Advance the development of DOI to improve image accuracy, repeatability, CNR, and depth sensitivity. AIM 1 – Instrumentation Continuous-wave and Time-Domain AIM 2 – Signal Processing Algorithms to filter signal clutter AIM 3 – Experiments to quantify improvements Parallel Efforts of Hardware development (year 1) and Signal Processing of physiological fluctuations (year 2) To come together in future years
Hitachi DYNOT ISS instrument development - CW Techen Inc
Sol Diamond Framework for Multimodal Analysis Key: u = observable inputs x = state variables w = process noise θ = model parameters z = physiological signals F = lead fields v = measurement noise y = measurements • Neurovascular physiology is modeled with a cascade of functions • Lead fields model the biophysics of each imaging modality • The functions evolve with neuroscience while the framework remains the same
Why fuse DOT and fMRI? • Combine best of bothSPECTRAL, TEMPORAL, and SPATIAL → better quantification of physiology ! • Improve statistical power in spatial map by improving rejection / filtering of systemic signals !
DOT Forward Model: www.nirx.net BOLD Forward Model: [i.e. Obata,T. et al (2004). NeuroImage21(1) 144-53] Caution: a bit of math
BOLD Calibration Joint forward operator States (unknowns) Observations Caution: a bit of math Simulations confirm improvement in quantitative accuracy in HbR !
Ted Huppert Experimental Results
Improved Quantitative HbR rCBF = 24% x10-7 x10⁻⁶ -9.5% < rHbR < -2.5% -3.8 M < HbR < -0.8 M 30 M < HbRo < 40 M Reconstructed Δ[HbR] Subject A DOT BOLD Fusion Cortical Constraint
Arteriole Capillary Venial Arteriole Capillary Venial • Oxygen diffusion between each compartment and extra-vascular tissue • Mitochondrial metabolism drains tissue pO2 Windkessel Model Analogous to a circuit model with oxygen diffusion • Flow/Volume changes are driven by changes in arteriole resistance
Windkessel Analysis of Human Data CMRO2 -6 x 10 ASL - CBF 0.3 8 HbO2 0.25 6 0.2 Molar HbT 4 Percent Change 0.15 0.1 2 0.05 0 HbR BOLD x 10 0 -2 -0.05 0 2 4 6 8 10 0 2 4 6 8 10 Time (sec) Time (sec) Baseline CMRO2 5.2 ml O2 / 100 g / min
Sol Diamond Framework for Multimodal Analysis Key: u = observable inputs x = state variables w = process noise θ = model parameters z = physiological signals F = lead fields v = measurement noise y = measurements • Neurovascular physiology is modeled with a cascade of functions • Lead fields model the biophysics of each imaging modality • The functions evolve with neuroscience while the framework remains the same
optical signal blood pressure DOD respiration time (sec) signal processing to filter physiological clutter from brain activation signals our raw optical data show ~1Hz cardiac pulsation, ~0.1-0.3 Hz blood pressure and respiration fluctuations • Need to filter this interference • Interference is physiology of interest (autoregulation)
Baseline physiology with simulated functional response added
Subject 1 Dynamic Estimator Subject 3 Recovering the hemodynamic response function
Flow response derived from real data Hemoglobin response in simulated data Hemoglobin response in simulated data Penelope J. EAMES, John F. POTTER and Ronney B. PANERAI Influence of controlled breathing patterns on cerebrovascular autoregulation and cardiac baroreceptor sensitivity, Clinical Science (2004) 106, 155–162 Cerebral autoregulation response to a step increase in blood pressure
Combine DOI and fMRIto get more complete understandingof physiology
(a) (b) (c) HbO2 HbR T S P2 P1 Left forepaw stimulation HbO2 HbR SEP contralateral - ipsilateral (mV) Right forepaw stimulation N1 sources detectors electrodes Coupling of the hemoglobin response with the N1 somatosensory evoked potential component and uncoupling with the other SEP components
amplitude duration 1s 1s 0.5MT 0.5MT HbO2 HbR 3s 3s 0.75MT 0.75MT SEP (au) hemoglobin conc. changes (au) hemoglobin conc. changes (au) SEP (au) 5s 5s MT MT 7s 7s 1.25MT 1.25MT 0 5 10 15 0 1 2 3 4 5 6 7 8 0 5 10 15 0 1 2 3 4 Time (s) Time (s) Time (s) Time (s) frequency 1Hz 1Hz 3Hz 3Hz SEP (au) hemoglobin conc. changes (au) 5Hz 5Hz 7Hz 7Hz 0 5 10 15 0 1 2 3 4 Time (s) Time (s)
HbO2 P1 N1 P2 S duration amplitude frequency 2 1.25 MT 3 4 5 6 7 8 s 1 3 2 1 4 5 6 7 8 Hz .75 HbO2 changes (au) 1 0.5 Time (s) HbO2 P1 N1 HbO2 changes (au) P2 S Time (s)
SS SP1 SN1 SP2 ST SHbO2 SHbR (a) (b) (c) Normalized SHbO2 or SSEP train duration (s) train amplitude (MT) train frequency (Hz) SP1 SN1 SP2 ST SHbO2 (a) (b) (c) Normalized SHbO2 Normalized SSEP
frontal cortex changes with age 80 P 0.00008 60 P 0.02 HbT (mM) P 0.001 40 20 4 3 P 0.1 P 0.005 CBV (ml/100g) P 0.000000001 2 1 P 0.004 70 P 0. 8 StO2 (%) 60 P 0.001 50 40 0 10 20 30 40 50 age (wks)
effect of the transition from fetal to adult hemoglobin 23 Oski & Naiman, Major Probl Clin Pediatr. 1982 Wolff & Goodfellow, Pediatrics 1955 less than 1.5Kg 21 25 19 23 17 term babies 21 15 HGB (g/dl) 19 13 17 HGB (g/dl) 11 15 13 less than 1.25Kg 9 11 7 9 5 7 0 1 2 3 4 5 6 7 8 9 10 5 age (wks) 25 30 35 40 45 50 55 60 65 70 75 80 85 90 GA (wks) 80 60 P 0.02 HbT (mM) 40 20 4 3 P 0.1 CBV (ml/100g) 2 1 P 0.004 70 StO2 (%) 60 50 40 0 10 20 30 40 50 age (wks)
the change in blood flow has a power law relation to the change in blood volume (we assume it accurate in our infant population) with 2≤≤3 cerebral metabolic rate of oxygen (CMRO2) StO2 = aSaO2 + bSvO2 with a+b=1 (we assume b constant with age and SaO2=1)
frontal cortex changes in CMRO2 1-6 wks DCMRO2=0.9 12-52 wks DCMRO2=1.3, b=2 DCMRO2=1.7, b=3 80 60 P 0.02 HbT (mM) P 0.001 40 20 4 3 P 0.1 P 0.005 CBV (ml/100g) 2 1 P 0.004 70 StO2 (%) 60 P 0.001 50 40 0 10 20 30 40 50 age (wks)
frontal cortex changes in CMRO2 • CMRO2 increases • consistent with increase in glucose metabolism observed by Chugani 8 months • CMRO2 constant & initial drop of StO2 due to the hematocrit drop • electrophysiological studies first two months synaptic activity very low • NMR studies in newborn very low rates of CMRO2 • energy requirements possibly met by nonoxidative metabolism 1-6 wks DCMRO2=0.9 12-52 wks DCMRO2=1.3, b=2 DCMRO2=1.7, b=3 40% increase in the sensorimotor cortex
The Team Optical Imaging Group Anna Custo Sol Diamond Maria Angela Franceschini Ted Huppert Danny Joseph Ilkka Nissila Juliette Selb MGH Giorgio Bonmassar Bruce Fischl Ellen Grant Matti Hamalainen Bruce Rosen Larry Wald USCD Anders Dale Northeastern University Dana Brooks Eric Miller Texas A&M Heather Bortfeld Teresa Wilcox Univ College London Simon Arridge Univ of Kuopio, Finland Jari Kaipio Ville Kolehmainen