Download
1 / 36
390 likes | 448 Views
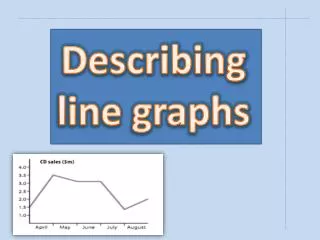
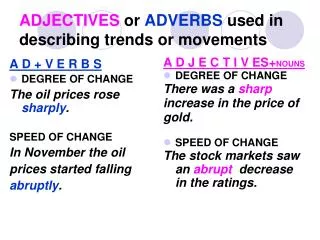
Describing Trends in Graphs. an upward trend (a rising trend). GO UP - G ROW GROWTH RISE RISE INCREASE INCREASE IMPROVE IMPROVEMENT - UPTURN SOAR - JUMP JUMP ( SKY ) ROCKET - SURGE SURGE - UPSURGE TAKE OFF TAKEOFF SHOOT UP - LEAP LEAP

E N D
GO UP - GROW GROWTH RISE RISE INCREASE INCREASE IMPROVE IMPROVEMENT - UPTURN SOAR - JUMP JUMP (SKY)ROCKET - SURGE SURGE - UPSURGE TAKE OFF TAKEOFF SHOOT UP - LEAP LEAP PEAK/REACH A PEAK PEAK TOP OUT -
DECREASE DECREASE GO DOWN - DECLINE DECLINE DROP DROP FALL (OFF) FALL SLIP SLIP - DOWNTURN SLIDE SLIDE DIP DIP PLUNGE PLUNGE PLUMMET PLUMMET NOSEDIVE NOSEDIVE SLUMP SLUMP CRASH CRASH SINK - TUMBLE TUMBLE
ECONOMICS IS FLYING (AIR) • PLUMMET • COLLISION • TURBULENCE • NOSEDIVE • FREE-FALL • SPIRAL • LANDING • GO THROUGH THE ROOF “When interest rates went through the roof, so did Mr Macdonald!”
ECONOMICS IS DIVING (WATER) • PLUNGE • FLOAT • DIP • DIVE • SINK
ECONOMICS IS MOVING ON THE GROUND • TUMBLE • JUMP • TOPPLE • SLIDE • SLIP • WOBBLE • STAGGER • STUMBLE
Change of direction to bottom out to recover to rebound to revive
to rebound 'Stocks rebounded from yesterday's losses on news that 'it aint over till it's over'.'
NO CHANGE • to remain stable • to level off/out • to stay at the same level • to remain constant • to stagnate • to stabilize
Adjectives can be used to describe the degree or speedof change. Do you know the corresponding adverbs ? dramatically abruptly suddenly moderately slightly rapidly gradually steadily erratically constantly
Look at these headlines and say whether the statements about them are true or false. F T T F T F T T
Choose the correctverbs and try to connect them with appropriate graphs according to the type of changethey describe: SLUMP RISE RECOVER PLUNGE PICK UP PLUMMET DROP SOAR BOUNCE BACK TAKE OFF CLIMB RALLY FLUCTUATE FALL CRASH HOLD STEADY FLATTEN OUT SLIDE ESCALATE DECLINE ROCKET DIP 5 2 6 5 1 6 5 4 1 2 6 6 7 4 5 4 3 3 1 4 1 4
Choose the correct words. • There was a slightly/slight rise in profits last month. • We rose/increased our profits slightly/slight last month. • There was a sharp fall in/of our sales last quarter. • Our sales fell by/of 6% last quarter. • We fell/recovered our market share last quarter. • Our share price hit/beat a low/down last month, but it has since recuperated/recovered and now stands at/in $3.89.
Our share price reached/met a top/peak in May, but it’s fallen back since then. • Inflation is increasing slow/slowly at the moment, in/by about 1% a year. • There is a slow/slowly increase in/of the rate of inflation, of/by about 1% a year. • Operating profits went from $2.5m to/until $3.1m. • Dividends paid to shareholders raised/rose by 6%. Last year they fell/cut. • This year we raised/rose dividends to shareholders. Last year we fell/cut them.
1 Production started climbing steadily but flattened off at a level of around 70. Since then, it has fallen steadily.
2 Production grew more and more rapidly over the first three quarters but then reached a peak. Since then, it has quickly dropped.
3 Production grew rapidly in the first quarter, but reached a plateau of about 70. Since then it has remained more or less stable.
4 Production has dropped slowly but steadily over the year.
5 Production started the year in a stable position, but then plunged in the third quarter. It has now flattened out at a level of 20.
6 After a considerable drop in the first two quarters, production bottomed out at 20. Since then it has started to rise.
7 Production fell considerably over the first three quarters, reaching a low of 20. Since then it has staged a partial recovery.
8 Production has fluctuated all year.
DRAW GRAPHS USING THE FOLLOWING INFORMATION: • After a three-year period of stability, the level of investment soared. • Since the late 1990s, immigration has been rising in most OECD countries. This followed a sharp downturn from the start of the decade. • After a sharp rise, sales levelled off during the period September-November, when they plunged again at the end of the year. • Sales crashed last week following a slight rise. • The share price reached a peak before falling a little and then maintaining the same level.