Download
1 / 31
320 likes | 525 Views
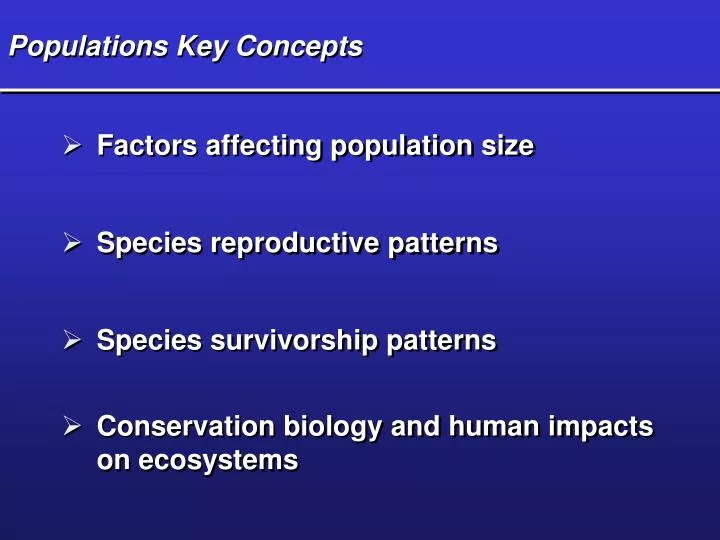
Populations Key Concepts. Factors affecting population size. Species reproductive patterns. Species survivorship patterns. Conservation biology and human impacts on ecosystems. Population Dynamics and Carrying Capacity. Population dynamics. Biotic potential (intrinsic rate of increase [r]).

E N D
Populations Key Concepts • Factors affecting population size • Species reproductive patterns • Species survivorship patterns • Conservation biology and human impacts on ecosystems
Population Dynamics and Carrying Capacity • Population dynamics • Biotic potential (intrinsic rate of increase [r]) • Environmental resistance • Carrying capacity • Exponential and Logistic Growth • Population Density
The biotic potential rmax is the population's capacity for growth. The intrinsic rate of increase (r) is the rate of population growth with unlimited resources.
No population can grow indefinitely due to limited resources such as light, water, and nutrients andalso due to competitors and/or predators.
Population Dynamics Populations change in size, density, dispersion and age structure. Population density —the number of individuals of a population that inhabit a certain unit of land or waterarea. Population dispersion—refers to how individuals of a population are spaced within a region. Age structure of a population is usually described as the pre-reproductive stage, the reproductive stage and the post-reproductive stage. A population with a large reproductive stage is likely to increase, while a population with a large post-reproductive stage is likely to decrease.
Population dispersion clumping dispersion the most common dispersion pattern for populations. In this type of dispersion, individuals "flock together.“ uniform dispersiona type of population dispersion in which the members of the population are uniformly spaced throughout their geographic region. random dispersion—a type of population dispersion in which the position of each individual is not determined or influenced by the other members of the population.
Population Dynamics Four variables influence/govern population size: (1)births, (2) deaths, (3) immigration, and (4) emigration. Increase in population occurs by birth and immigration. Decrease in population occurs by death and emigration.
Factors Affecting Population Size Biotic Potential v. Environmental Resistance Fig. 9-3 p. 166
Figure 9-4Page 166 Biotic Potential v. Environmental Resistance (Logistic Population Growth) Carrying capacity (K) is determined by biotic potential and environmental resistance. This is the number of a species' individuals that can be sustained indefinitely in a specific space. Four variables influence/govern population size: (1)births, (2) deaths, (3) immigration, and (4) emigration. Increase in population occurs by birth and immigration. Decrease in population occurs by death and emigration. Environmentalresistance Carrying capacity (K) Population size (N) Biotic potential Exponential growth Time (t)
Density and Limiting Factors The density of a population may or may not affect how rapidly it can grow. 1. Density-independent population controls affect a population's size regardless of its density. These are abiotic factors in the community. 2. Density-dependent factors or population controls have a greater affect on the population as its density increases. Infectious disease is an example of density-dependent population control.
Natural Population Curves Fig. 9-7 p. 168
The Role of Predation in Controlling Population Size Fig. 9-8 p. 168 • Predator-prey cycles (Boom and Bust) • Top-down control • Bottom-up control
Reproductive Patterns and Survival • Sexual reproduction • Asexual reproduction • K-selected species • r-selected species Fig. 9-10 p. 170
Reproductive Patterns and Survival Reproductive patterns can be classified into twofundamental reproductive patterns: r-selected and K-selected species. r-Selected species are opportunists and reproduce when conditions are favorable or when disturbance opens a niche for invasion. Most species of this type go through irregular and unstable boom-and-bust cycles in population size. K-selected species generally follow a logistic growth curve. Many of the larger species with long generation times and a low reproductive rate are prone to extinction. Availability of a suitable habitat for individuals of a population ultimately determines the population size.
A survivorship curve is one way to represent age structure of a population. Three generalized types of survivorship curves are: (1) late loss, (2) early loss, and (3) constant loss. A life table shows the numbers of individuals at each age on a survivorship curve. Insurance companies use life tables to determine the cost of insurance policies. Populations of different species vary in how long individual members typically live.
Effects of Genetic Variations on Population Size Variations in genetic diversity can affect the survival of small, isolated populations. Several factors can play a role in loss of genetic diversity and survival of a small population. Founder effect is when a few individuals move to a new location that is isolated from the original population. There is limited genetic diversity in such a population. Demographic bottleneck occurs when only a few individuals survive a catastrophe. Genetic drift is a third factor and involves random changes in gene frequencies in a population. This may help or hurt the survival of the population. Inbreeding occurs when members of a small population mate one another; this may increase the numbers of defective genes in a population.
Human Impacts on Ecosystems • Habitat degradation and fragmentation • Ecosystem simplification • Genetic resistance • Predator elimination • Introduction of non-native species • Overharvesting renewable resources • Interference with ecological systems
Human Populations Key Concepts • Factors affecting human population size • Human population problems • Managing population growth
Factors Affecting Human Population Size Population Change = (Births + Immigration) – (Deaths + Emigration) Demography is the study of the size, composition, and distribution of human populations and the causes and consequences of changes in these characteristics. Population change equation • Crude birth rate (BR) The crude birth rate is the number of live births per 1,000 people in a population in a specific year.| • Crude death rate (DR) The crude death rate is the number of deaths per 1,000 people in a population in a specific year
Describing Population Changes Doubling Times “Rule of 70”:Doubling time is one measure of population growth. Fertility-is the number of births that occur to an individual woman in a population. Replacement-level Fertility—the number of children a couple must have in order to replace themselves in a population. Total Fertility Rate (TFR)—the number of children a woman will bear during her lifetime; this information is based on an analysis of data from preceding years in the population in question.
Factors Affecting Human Population Size There are currently more births than deaths throughout the world. 1. The annual rate of natural population change (%) equals birth rate minus death rate divided by 1,000 persons multiplied by 100. 2. The rate of the world's population growth has decreased. 3. The annual population growth dropped by almost half between 1963 and 2004, from 2.2% to 1.2%. But during this same period, the population base doubled from 3.2 to 6.4 billion.
Factors Affecting Human Population Size There is a big difference in the exponential population growth rates of developed and developing countries, with developed countries growing at 0.25% and developing countries growing at 1.46%— almost six times faster. The six fastest growing countries in terms of population are: India, China, Pakistan, Nigeria,Bangladesh, and Indonesia. The populations of China and India comprise 38% of the world's population. The next most populated country is the United Stated with 4.6% of the world's population.
Factors Affecting Birth Rates and Total Fertility Rates • Children in Labor Force • Cost of raising and educating children • Availability of pension systems • Urbanization • Education and employment for women • Infant mortality rate • Average marrying age • Abortion • Availability of birth control
Factors Affecting Birth Rates and Total Fertility Rates Many factors influence birth and fertility rates. More children work in developing countries; they are important to the labor force. The economic cost of raising and educating children determines their numbers. the more children cost, the less children people tend to have. If there are available private/public pension systems, adults have fewer children because they don't need children to take care of them in old age. People in urban areas usually have better access to family planning, so they have fewer children. If women have educational and economic choices, they tend to have fewer children. When the infant mortality rate is low, people have fewer children because children are not being lost to death. The older the age at which women marry, the fewer children they bear. If abortions are available and legal, women have fewer children. The availability of reliable birth control allows women to space children and determine the number of children they bear.
Who is Over Populated? CNN-The People Bomb
Population Age Structure Male Female Rapid Growth Guatemala Nigeria Saudi Arabia Slow Growth United States Australia Canada Zero Growth Spain Austria Greece Negative Growth Germany Bulgaria Sweden Ages 0-14 Ages 15-44 Ages 45-85+ Fig. 10-14 p. 184
The Demographic Transition Stage 1 Preindustrial Stage 2 Transindustrial Stage 3 Industrial Stage 4 Postindustrial High 80 70 60 Birth rate 50 Birth rate and death rate (number per 1,000 per year) Relative population size 40 30 Death rate 20 10 Total population Low 0 Low growth rate Increasing Growth growth rate Very high growth rate Decreasing growth rate Low growth rate Zero growth rate Negative growth rate Time Fig. 10-20 p. 189
Solutions: Influencing Population Size • Migration • Environmental refugees • Reducing births • Family planning • Empowerment of women • Economic rewards and penalties