Download
1 / 35
360 likes | 868 Views
Key Concepts . Differentiation (What you do to an offering) : Creating tangible or intangible differences on one or more attributes between a focal offering and its main competitors.

E N D
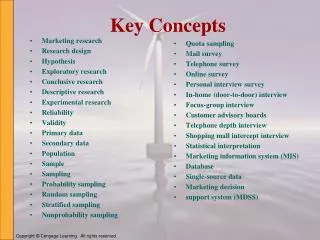
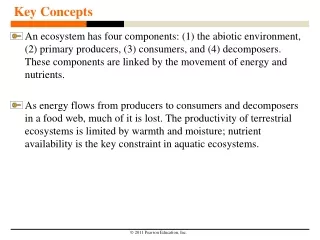
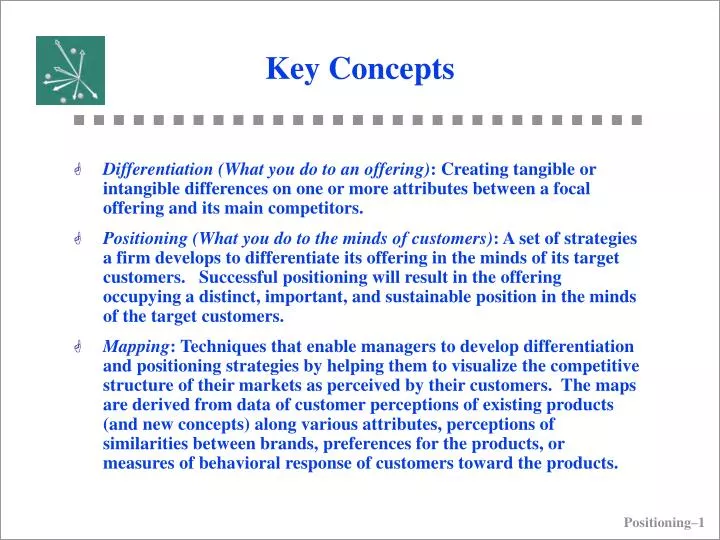
Key Concepts • Differentiation (What you do to an offering): Creating tangible or intangible differences on one or more attributes between a focal offering and its main competitors. • Positioning (What you do to the minds of customers): A set of strategies a firm develops to differentiate its offering in the minds of its target customers. Successful positioning will result in the offering occupying a distinct, important, and sustainable position in the minds of the target customers. • Mapping: Techniques that enable managers to develop differentiation and positioning strategies by helping them to visualize the competitive structure of their markets as perceived by their customers. The maps are derived from data of customer perceptions of existing products (and new concepts) along various attributes, perceptions of similarities between brands, preferences for the products, or measures of behavioral response of customers toward the products.
Crowded Markets Consumers face increasing number of choices • Over 8,200 mutual funds • Over 150 models of cars • Over 30,000 products in a grocery store • Over 100,000 prescription drugs If we can figure out in the crowd, we will have a better handle on our future profitability.
Some Positioning Bases • Life style (self-concept) positioning • Attribute positioning • Benefit positioning • Competitive positioning • Time-based (e.g., usage occasion) positioning
Generic Positioning Strategies • Our product is unique (eg, Perdue chicken). • Our product is different (eg, Listerine). • Our product is similar (eg, Meister Brau).
Apple iPod BMW Burger King Charmin Tissue Coke Chevy Trucks Colgate Total Toothpaste Disney GE Mobil Service Stations Universal’s Orlando Visa Volvo Viagra Lipitor Some SuccessfulPositioning Themes 1000 songs Exceptional performance Have it your way Softness Authentic, real, original Tough, strong, durable Total dental protection Wholesome family entertainment Improves the quality of life Fast, friendly service Thrills, excitement, escape Accepted everywhere Safety Quality of life More potent at lower price
Marketing Opportunities Associated with Positioning • Find unmet (or inadequately met) customer needs and wants. • Identify product strengths that are unique and important. • Determine how best to overcome product weaknesses. • Identify market segments for which a particular product or new concept would be appealing.
Initiating Positioning Studies in Companies Four questions that could trigger positioning analyses • Who do we need to target? • What do they think now? • What do we want them to think, now and from now on? • How do we do that?
Why Mapping? An organic chemist reads diagrams such as the one here An Electrical Engineer reads diagrams such as the one here Positioning 8
Can You See Patterns in These Customer Data? Ratings of nine brands of notebook computers on several attributes B1 B2 B3 B3 B4 B5 B6 B7 B8 New Attractive 5.1 3.6 3.5 5.4 3.9 4.8 5.2 4.0 5.2 4.0Light 6.0 3.5 5.0 3.9 3.3 5.3 5.0 2.5 5.5 2.5Unreliable 3.4 4.1 4.5 2.1 4.5 2.7 4.5 3.7 2.5 3.8Plain 1.5 4.1 2.9 2.3 4.5 2.7 3.5 4.3 2.2 5.2Battery life 3.3 4.9 4.3 4.1 3.9 3.0 3.5 6.2 3.5 4.0Screen 3.5 5.3 3.4 6.4 5.4 5.2 3.3 6.0 3.3 4.8Keyboard 2.6 3.5 2.5 3.4 3.8 3.3 2.8 5.0 4.3 4.7Roomy 5.5 4.3 5.4 3.1 3.4 3.3 4.7 3.5 4.3 4.2Easy service 4.5 4.9 3.3 5.0 4.4 4.5 3.3 4.7 3.8 4.5Expandability 5.5 4.3 5.4 3.1 3.4 3.3 4.7 3.5 4.3 4.2Setup 5.6 3.5 5.6 5.4 2.5 4.2 5.2 3.3 5.8 2.5Common 4.1 3.5 3.3 2.9 4.0 4.3 2.2 4.2 3.3 4.2Value 3.5 4.8 4.4 3.6 3.6 2.7 3.2 4.7 3.5 4.0Preference 7.4 3.4 4.8 6.6 4.4 7.4 7.1 3.8 6.9 3.3
Conventional Mapping UsingSnake Charts Does notDescribes it describecompletely it at all | | | | | | 0 1 2 3 4 5 1. Company provides adequate insurance coverage for my car. 2. Company will not cancel policy because of age, accident experience, or health problems. 3. Friendly and considerate. 4. Settles claims fairly. 5. Inefficient, hard to deal with. 6. Provides good advice about types and amounts of coverage to buy. 7. Too big to care about individual customers. 8. Explains things clearly. 9. Premium rates are lower than most companies. 10. Has personnel available for questions all over the country. 11. Will raise premiums because of age. 12. Takes a long time to settle a claim. 13. Very professional/modern. 14. Specialists in serving my local area. 15. Quick, reliable service, easily accessible. 16. A “good citizen” in community. 17. Has complete line of insurance products available. 18. Is widely known “name company”. 19. Is very aggressive, rapidly growing company. 20. Provides advice on how to avoid accidents.
Uses of Mapping Techniques • Check how customer perceptions of your products compare to those of your competitors. • Identify product strengths and weaknesses. • Select competitors to compete against. • Determine exactly how much change is need on key product attributes to move your products to more favorable positions. • Visually determine whether your communications programs are having the desired impact on market perceptions (Before-After study). • Compare perceptions from different demographic, geographic, or psychographic subgroups in your market.
Mapping Techniques • Mapping perceptions • Attribute-ratings methods (particularly useful for functional products) • Overall-similarity methods (particularly useful for image-oriented products) • Mapping preferences • Include an overall preference vector in a perceptual map • “External” analysis to fit preferences of individuals on a common perceptual map
Mapping Methods in Marketing Perceptual Maps Joint Space Maps(includes both perception & preference) Preference Maps Similarity-based methods Attribute-based methods Ideal-point model(unfolding model) Vector model External analysisusing PREFMAP-3 Simple “joint space maps” using modified perceptual mapping methods Included in Marketing Engineering. Coming soon: Ideal-point model Positioning 14
Perceptual Maps Using Attribute Ratings Example: Positioning of Beers • Select a set of Beers e of interest to the target group of customers. • Identify a set of key attributes on which these Beers evaluated by the target group (e.g., through focus groups). • Ensure that customers are familiar with the products of interest. • Have customers evaluate the products on the chosen set of attributes (e.g., Light-Heavy; Cheap-Expensive; Drink alone-Share with friends). • If desired, include “Preference for the Beers” as one of the attributes.
Perceptual Map of Beer Market (This slide shows only the products) Old Milwaukee Budweiser Beck’s Meister Brau Heineken Miller Coors Stroh’s Michelob Coors Light Miller Lite OldMilwaukee Light
Perceptual Map of Beer Market (This slide shows only the attributes) Heavy Popular with Men Heavy Full Bodied Special Occasions Blue Collar Dining Out Premium Good Value Budget Premium Popular with Women Pale Color On a Budget Light Less Filling Light
Perceptual Map of Beer Market (This slide includes both products and attributes) Heavy Popular with Men Heavy Full Bodied Old Milwaukee Budweiser Beck’s Meister Brau Heineken Special Occasions Miller Blue Collar Dining Out Premium Good Value Coors Stroh’s Budget Premium Michelob Popular with Women Coors Light Miller Lite Pale Color On a Budget OldMilwaukee Light Light Less Filling Light Interesting web site to visit: www.ratebeer.com
Guidelines for Interpreting Perceptual Maps • The arrow indicates the direction in which that attribute is increasing (The attribute is decreasing in the direction opposite to the arrow). Thus, a beer positioned farther and farther in the North East direction are popular with men, whereas a beer positioned in the South West direction is less popular with men. • The length of the line from the origin to the arrow is an indicator of the variance of that attribute explained by the 2D map. The longer this line, the greater is the importance of that attribute in helping you to interpret the map. Thus, “Good value” and “Less filling” are relatively more important than “Pale color” and “Blue collar” in explaining how this group of customers discriminates between the different beers.
Guidelines for Interpreting Perceptual Maps (contd.) • Attributes that are both relatively important and close to the horizontal (vertical) axis help you in articulating the meaning of the axis. Here, the two dimensions along which these customers seem to discriminate between the beers appear to be “Budget-Premium” for the horizontal axis and “Light-Heavy” for the vertical axis. This interpretation can be based on attributes most correlated with the axes (Premium, Special occasions, Blue collar, Budget, etc. for the horizontal axis, and Heavy, Light, Pale color for the vertical axis). • To position a particular beer on an attribute, draw an imaginary perpendicular line from the location of that beer onto that attribute. (These are shown by dashed lines on the map). Thus, Budweiser is perceived to more popular with men than Coors.
Mapping Preferences Objective—Introduce customer preferences into perceptual maps: • A simple ideal point method: Introduce an “ideal” brand as an additional stimulus evaluated by customers. 1. Combine attribute ratings of ideal brand with the other brands. 2. Compare how similar the ideal brand is to the other brands included in the study. • A simple vector method: Introduce “preferences” as an additional variable in the attribute ratings data 1. Analyze the preference variable simultaneously with evaluations of the cars on each attribute. • Identify which attributes influence consumer preferences the most • Identify which brands are most preferred in the aggregate. 2. Analyze preferences separately for each customer. • Identify target segments that prefer the brand of interest the most.
Mapping Preferences cont’d • PREFMAP-3 External Analysis • First, develop a perceptual map of competing alternatives. • Given the fixed positions of the alternatives on the perceptual map, add the preferences of each customer on the perceptual map (this approach is called external analysis). Marketing Engineering includes an option to do External Analysis.
Two Preference Models Ideal-Point Preference Model Vector Preference Model IncreasingPreference Preference Preference DecreasingPreference Ideal Point Attribute Attribute (eg, sweetness) (eg, service speed)
Ideal-Point Map Ideal Point (I) dIA dIB A B (a)A is preferred twice as much as B.(dIB = 2dIA) Interpreting Preference Maps Vector Map Preference Vector A dAC dAB C B (b)A is preferred to B and B is preferred to C.With reference to A, C is preferred half as much as B.(dAC = 2dAB)
Vector Method for Representing Aggregate Preferences • Matrix of inputs: • A1 A2 A3 A4 ............... A15, PREF • Dell 320N 4 3 4 1 2 2 • C1 TI Travelmate 6 3 7 2 8 8 • Toshiba concept 3 6 2 7 6 6 • • • • • Dell 320N • C2 TI Travelmate • Toshiba concept • Note: A higher number on PREF indicates higher preference for that brand. • Compute average ratings of each brand on each attribute and the average preferences for each brand. • Obtain a “joint space” map from Marketing Engineering software showing relationships between brands and their evaluations on each attribute. • Interpret the map. The relative locations of the brands are directly provided by the map. The orientation of the attributes (including preference) are determined by drawing vectors from the origin to each attribute. The position of a brand on an attribute is determined by drawing a perpendiclar line from thebrand location to the attribute orientation.
Preference Map Using Vector Model Low battery life Keyboard Expandability • Toshiba Elegant Distinct Unsuccessful Avant-Garde Heavy Fast operation • IBM • Compaq Reliable • Sanyo • Good design • TI • AST Exec Difficult to use • Dell • NEC Value Graphics • New Concept Poor setup • Samsung Screen quality • Preference
Data for PREFMAP-3 for External Analysis • Matrix of inputs: • C1 C2 C3 C4 ............... • Newton 2 3 9 3 • HP200LX 7 7 2 5 • Canon 3 8 3 5 • • • • • An element of this matrix is the stated preference of each consumer (C1, C2, . . .) for each brand. A higher number indicates higher preference for that brand. • Use the Preference Map option in Marketing Engineering to obtain a “joint space” map showing relationships between brands and preferences between brands for each consumer. • Interpret the map. The relative locations of the brands are directly provided by the map. The direction in which an individual consumer’s preferences are increasing is determined by drawing a vector from the origin to each consumer’s ID displayed on the map. The relative preference for a brand for an individual consumer is determined by drawing a perpendicular from the brand location to the preference orientation. Identify target segments by examining consumer groupings on the map.
A Joint-Space Map (This Example Only Shows Preferences and Brands)
Evaluating Perceptual and Preference Maps • Technical adequacy • What percentage of the total information (variance) in the raw data is captured in the map? • What percentage of the information of each attribute (variance) is captured in the map? • Managerial interpretation (example questions) • What underlying dimensions seem to characterize how customers view the products? • What is the competitive set associated with the target product or new concept? • How well is a target product positioned with respect to the existing products? • Which attributes are related to each other? • Which attributes influence customer preferences positively? negatively? • What improvements will enhance the value of a product or new concept? • Which customer segments have positive perceptions and high preference for the product?
Example Positioning Statements For [target segment], the [product/concept] is [most important claim] because [single most important support]. Iomega For [PC Users], the [IOMEGA Zip drive] isthe [best portable storage device]because[it is most cost-effective system]. JC Penney For[Modern Spenders and Starting-outs in mid-income levels who shop for apparel, accessories, and home furnishings]we offer[private-label, supplier exclusive, and national brands]that [deliver greater value than that of our competitors]because of[our unique combination of quality, selection, fashion, service, price, and shopping experience]. (From jcpenney.com)
Example Positioning Statements Pantene • For [females 18-49 who possess dry damaged hair and believe they cannot achieve truly healthy/shiny hair] Pantene is a [hair care system (shampoo/conditioner/ styling aids)] that offers[“hair so healthy it shines”] because it [“penetrates from root to tip” through its patented Pro-Vitamin B5 formula]. Microsoft .NET • For [companies whose employees and partners need timely information], Microsoft.NET is a [new protocol and software system]that enables[unprecedented levels of software integration through XML Web services], because [unlike Java, .NET is infused into the Microsoft platform, providing the ability to quickly and reliably build, host, deploy, and utilize connected applications].
Implementing Positioning • Leverage strategically advantaged resources: • Product characteristics • features, performance, durability, conformance, reliability, style, etc. • Service attributes • delivery, installation, consultation, customer training, repair, etc. • Personnel • competency, credibility, courtesy, responsiveness, etc. • Brand image • symbols, emotion, personality, etc.
Positioning is not ... • just clever slogans or gloss • what we push on our customers -- it is what customers will realistically grant us • a one-time activity • an appeal to everyone • a way to make our product superior -- it is about finding a superior position in the minds of customers.
Limitations • Provides a static model - ignores dynamics of customer perceptions. • Interpretation is sometimes difficult. • Does not incorporate cost or likelihood of being able to achieve a desired positioning. • Does not incorporate a “probability model” to indicate goodness of a map. • Generally, need about 6 to 8 products in a category to make the technique useful.