Download
1 / 2
20 likes | 160 Views
High Resolution Stratigraphy and Parasequences of the Oriskany Sandstone, Mapleton, Pennsylvania Jason Abplanalp and David Lehmann, Juniata College, Huntingdon, PA 16652Contact: abplajm0@juniata.edu. Abstract:

E N D
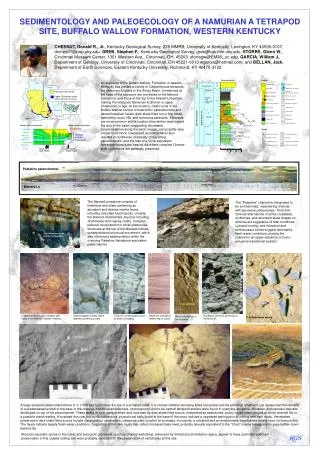
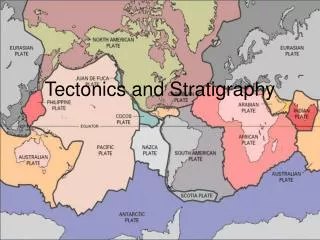
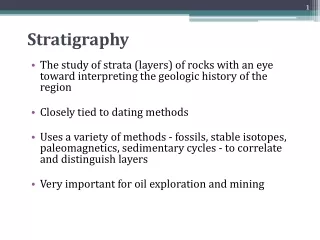
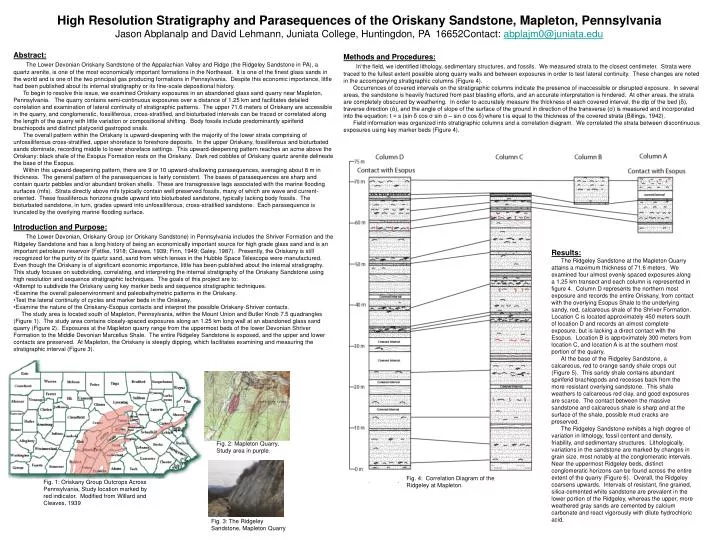
High Resolution Stratigraphy and Parasequences of the Oriskany Sandstone, Mapleton, Pennsylvania Jason Abplanalp and David Lehmann, Juniata College, Huntingdon, PA 16652Contact: abplajm0@juniata.edu • Abstract: • The Lower Devonian Oriskany Sandstone of the Appalachian Valley and Ridge (the Ridgeley Sandstone in PA), a quartz arenite, is one of the most economically important formations in the Northeast. It is one of the finest glass sands in the world and is one of the two principal gas producing formations in Pennsylvania. Despite this economic importance, little had been published about its internal stratigraphy or its fine-scale depositional history. • To begin to resolve this issue, we examined Oriskany exposures in an abandoned glass sand quarry near Mapleton, Pennsylvania. The quarry contains semi-continuous exposures over a distance of 1.25 km and facilitates detailed correlation and examination of lateral continuity of stratigraphic patterns. The upper 71.6 meters of Oriskany are accessible in the quarry, and conglomeratic, fossiliferous, cross-stratified, and bioturbated intervals can be traced or correlated along the length of the quarry with little variation or compositional shifting. Body fossils include predominantly spiriferid brachiopods and distinct platycerid gastropod snails. • The overall pattern within the Oriskany is upward-deepening with the majority of the lower strata comprising of unfossiliferous cross-stratified, upper shoreface to foreshore deposits. In the upper Oriskany, fossiliferous and bioturbated sands dominate, recording middle to lower shoreface settings. This upward-deepening pattern reaches an acme above the Oriskany: black shale of the Esopus Formation rests on the Oriskany. Dark red cobbles of Oriskany quartz arenite delineate the base of the Esopus. • Within this upward-deepening pattern, there are 9 or 10 upward-shallowing parasequences, averaging about 8 m in thickness. The general pattern of the parasequences is fairly consistent. The bases of parasequences are sharp and contain quartz pebbles and/or abundant broken shells. These are transgressive lags associated with the marine flooding surfaces (mfs). Strata directly above mfs typically contain well preserved fossils, many of which are wave and current-oriented. These fossiliferous horizons grade upward into bioturbated sandstone, typically lacking body fossils. The bioturbated sandstone, in turn, grades upward into unfossiliferous, cross-stratified sandstone. Each parasequence is truncated by the overlying marine flooding surface. • Introduction and Purpose: • The Lower Devonian, Oriskany Group (or Oriskany Sandstone) in Pennsylvania includes the Shriver Formation and the Ridgeley Sandstone and has a long history of being an economically important source for high grade glass sand and is an important petroleum reservoir (Fettke, 1918; Cleaves, 1939; Finn, 1949; Galey, 1987). Presently, the Oriskany is still recognized for the purity of its quartz sand, sand from which lenses in the Hubble Space Telescope were manufactured. Even though the Oriskany is of significant economic importance, little has been published about the internal stratigraphy. This study focuses on subdividing, correlating, and interpreting the internal stratigraphy of the Oriskany Sandstone using high resolution and sequence stratigraphic techniques. The goals of this project are to: • Attempt to subdivide the Oriskany using key marker beds and sequence stratigraphic techniques. • Examine the overall paleoenvironment and paleobathymetric patterns in the Oriskany. • Test the lateral continuity of cycles and marker beds in the Oriskany. • Examine the nature of the Oriskany-Esopus contacts and interpret the possible Oriskany-Shriver contacts. • The study area is located south of Mapleton, Pennsylvania, within the Mount Union and Butler Knob 7.5 quadrangles (Figure 1). The study area contains closely-spaced exposures along an 1.25 km long wall at an abandoned glass sand quarry (Figure 2). Exposures at the Mapleton quarry range from the uppermost beds of the lower Devonian Shriver Formation to the Middle Devonian Marcellus Shale. The entire Ridgeley Sandstone is exposed, and the upper and lower contacts are preserved. At Mapleton, the Oriskany is steeply dipping, which facilitates examining and measuring the stratigraphic interval (Figure 3). Methods and Procedures: In the field, we identified lithology, sedimentary structures, and fossils. We measured strata to the closest centimeter. Strata were traced to the fullest extent possible along quarry walls and between exposures in order to test lateral continuity. These changes are noted in the accompanying stratigraphic columns (Figure 4). Occurrences of covered intervals on the stratigraphic columns indicate the presence of inaccessible or disrupted exposure. In several areas, the sandstone is heavily fractured from past blasting efforts, and an accurate interpretation is hindered. At other areas, the strata are completely obscured by weathering. In order to accurately measure the thickness of each covered interval, the dip of the bed (δ), traverse direction (ά), and the angle of slope of the surface of the ground in direction of the transverse (σ) is measured and incorporated into the equation: t = s (sin δ cos σ sin ά – sin σ cos δ) where t is equal to the thickness of the covered strata (Billings, 1942). Field information was organized into stratigraphic columns and a correlation diagram. We correlated the strata between discontinuous exposures using key marker beds (Figure 4). . Results: The Ridgeley Sandstone at the Mapleton Quarry attains a maximum thickness of 71.6 meters. We examined four almost evenly spaced exposures along a 1.25 km transect and each column is represented in figure 4. Column D represents the northern most exposure and records the entire Oriskany, from contact with the overlying Esopus Shale to the underlying sandy, red, calcareous shale of the Shriver Formation. Location C is located approximately 450 meters south of location D and records an almost complete exposure, but is lacking a direct contact with the Esopus. Location B is approximately 300 meters from location C, and location A is at the southern most portion of the quarry. At the base of the Ridgeley Sandstone, a calcareous, red to orange sandy shale crops out (Figure 5). This sandy shale contains abundant spiriferid brachiopods and recesses back from the more resistant overlying sandstone. This shale weathers to calcareous red clay, and good exposures are scarce. The contact between the massive sandstone and calcareous shale is sharp and at the surface of the shale, possible mud cracks are preserved. The Ridgeley Sandstone exhibits a high degree of variation in lithology, fossil content and density, friability, and sedimentary structures. Lithologically, variations in the sandstone are marked by changes in grain size, most notably at the conglomeratic intervals. Near the uppermost Ridgeley beds, distinct conglomeratic horizons can be found across the entire extent of the quarry (Figure 6). Overall, the Ridgeley coarsens upwards. Intervals of resistant, fine grained, silica-cemented white sandstone are prevalent in the lower portion of the Ridgeley, whereas the upper, more weathered gray sands are cemented by calcium carbonate and react vigorously with dilute hydrochloric acid. Fig. 2: Mapleton Quarry, Study area in purple. Fig. 4: Correlation Diagram of the Ridgeley at Mapleton. Fig. 1: Oriskany Group Outcrops Across Pennsylvania, Study location marked by red indicator. Modified from Willard and Cleaves, 1939 Fig. 3: The Ridgeley Sandstone, Mapleton Quarry
Fig. 5: Basal orange, silty shale. Fig. 7: Fossil and Conglomerate Layer Fig. 6: Upper Ridgeley Conglomerate Layer The thicker (.3 - 1 meter) conglomeratic intervals within the sandstone typically contain abundant molds of large snails and brachiopods (Figures 7, 8). Fossil horizons of the Oriskany are not entirely limited to the conglomeratic intervals. Significant heavy fossil beds and preserved burrows may be present above the conglomeratic intervals and are most notably located at the upper portion of the Ridgeley. Generally these fossiliferous intervals grade upward to unfossiliferous, fine grained sandstone. Light, low angle cross bedding is common within these unfossiliferous strata of the Ridgeley. These intervals vary in thickness (.25 – 3 meters), and the average dip of the cross beds is approximately 12o to the southwest (Figure 9). Unfossiliferous beds are typically erosionally truncated and overlain by conglomeratic and fossiliferous intervals. The contact between the Oriskany and the overlying Esopus is abrupt. Above the Oriskany there is a thin layer of loose, white sand which in turn is overlain by loose, rounded and uniform cobbles of dark red sandstone. These cobbles are directly overlain by the dark shale of the Esopus Formation. Fig. 10: Area A represents fossiliferous lower shoreface, area B represents sparsely fossiliferous and bioturbated middle shoreface, and area C represents laminated and massive upper shoreface environments. Fig. 9: Low angle crossbedding Fig. 8: Snail Molds Interpretations: The Ridgeley Sandstone records a variety of shoreface settings: the lower shoreface is represented by fossiliferous sandstone; the middle shoreface is represented by bioturbated sandstones that are sparsely fossiliferous, and the upper shoreface is represented by low angle cross-laminated, unfossiliferous sandstone (Figure 10). We believe that the quartz pebble conglomeratic intervals, which may contain fossils and are typically overlain by fossiliferous sandstone record transgressive lag deposits. The fauna of the Ridgeley help delineate and interpret the depositional environment. Fauna is dominated by heavy-shelled brachiopods and platycerid snails (Figure 8). Although all fossils are molds, taphonomy of the fossils is variable. Highly abraded fragments of thick shells are preserved in some sandstone, but in other sandstone brachiopods and gastropods are preserved in situ. Some shells have consistent orientation (current alignment). The fauna and taphonomy are all consistent with water depths from shallow storm wave base to at or above fair weather wave base (Seilacher, 1968). At the time of Oriskany deposition, sea level was transgressing (Ver Straeten, 1996), and the Oriskany is part of a transgressive systems tract. The Ridgeley strata can be further subdivided and correlated using parasequences (Figure 11). Each parasequence has a marine flooding surface (MFS) at its base, indicating a deepening event and contains upward shallowing/shoaling sedimentary deposits. In the lower part of the Ridgeley, parasequences typically contain middle shoreface to upper shoreface deposits. In the upper part of the Ridgeley, parasequences contain lower- to middle shoreface deposits. MFS are overlain by shell and quartz pebble lags, likely the result of ravinement. Lower, middle, and upper shoreface deposits are present in some parasequences. These parasequences are small scale, without widespread unconformity delineating the bases. The Oriskany is interpreted as being a result of transgressive systems tract deposition (Ver Straeten, 1996). The basal and upper unconformities each indicate a shift in water depth of the “Oriskany Sea” (Stow, 1938). The basal unconformity defines the base of the sequence, and the unconformity separating the Oriskany from the Esopus may record condensation (sediment starvation) within the transgressive systems tract to which the Oriskany belongs. Indeed, the overall pattern of parasequences in the Ridgeley indicates upward deepening (Figure 12). Fig. 11: Correlated Parasequences. Fig. 12: Representative sea level curve based on established parasequence boundaries. References Cited Billings, M. P., 1942, Structural Geology; Prentice-Hall, New York: 474 pp. Cleaves, A.B., 1939, Chapter III: The Oriskany Group, in Willard, B., The Devonian of Pennsylvania: Pennsylvania Geological Survey, Bulletin G 19, p. 92-130. Fettke, C. R., 1918, The glass sands of Pennsylvania: Science, New Series: v. 48, n. 1230, p. 98-100. Finn, F. H., 1949, Geology and occurrence of natural gas in Oriskany Sandstone in Pennsylvania and New York: Bulletin of the American Association of Petroleum Geologists, v. 33, n. 3, p. 303-335. Galey, J. T., 1987, Oriskany gas sand in Western Pennsylvania, Eastern Ohio, and Northern West Virginia: Bulletin of the American Association of Petroleum Geologists, v. 71, n. 9, p. 1104. Seilacher, A., 1968, Origin and diagenesis of the Oriskany Sandstone (Lower Devonian, Appalachians) as reflected in its shell fossils, in Muller, G., ed., Recent Developments in Carbonate Sedimentology in Central Europe: Springer-Verlag, New York, p. 175-185. Stow, M., 1938, Conditions of sedimentation and sources of the Oriskany Sandstone as indicated by petrology: Bulletin of the American Association of Petroleum Geologists, v. 22, n. 5, p. 541-564. Ver Straeten, C.A., 1996, Upper Lower and Lower Middle Devonian Stratigraphic Synthesis, Central Appalachian Basin of Pennsylvania: University of Rochester, Rochester: (PHD Thesis). 800 p.