1 / 16

Solve & Graph

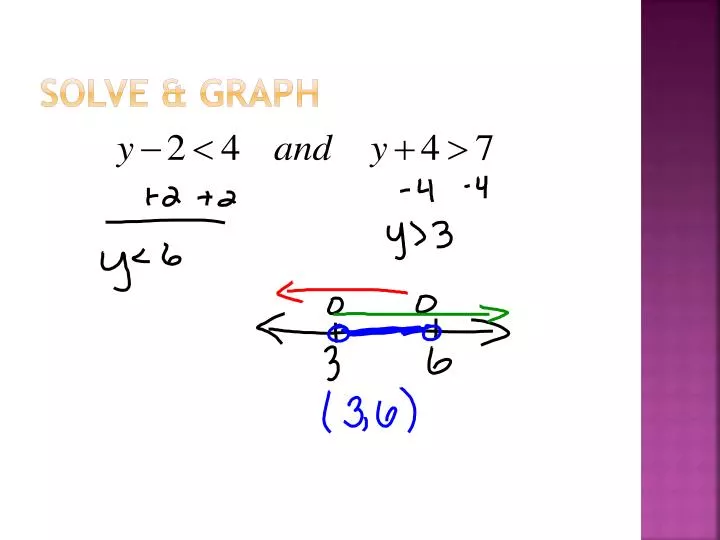
Solve & Graph. Solve & Graph. Solve & Graph. Graphing Linear Inequalities. Graph 2x-3y<9. Graphing linear inequalities. Graph 3x+4y > -8. Graphing Linear inequalities. Graph -2x-5y>15. Scatterplots & Line of Best Fit. Create a scatterplot & find the line of best fit.

onawa
Download Presentation

Solve & Graph

An Image/Link below is provided (as is) to download presentation Download Policy: Content on the Website is provided to you AS IS for your information and personal use and may not be sold / licensed / shared on other websites without getting consent from its author. Content is provided to you AS IS for your information and personal use only. Download presentation by click this link. While downloading, if for some reason you are not able to download a presentation, the publisher may have deleted the file from their server. During download, if you can't get a presentation, the file might be deleted by the publisher.

E N D

Presentation Transcript


  1. Solve & Graph

  2. Solve & Graph

  3. Solve & Graph

  4. Graphing Linear Inequalities • Graph 2x-3y<9

  5. Graphing linear inequalities • Graph 3x+4y > -8

  6. Graphing Linear inequalities • Graph -2x-5y>15

  7. Scatterplots & Line of Best Fit

  8. Create a scatterplot & find the line of best fit.

  9. Using the graphing calculator:

  10. Graphing steps continued

  11. Correlation • Used to describe the relationship between the independent variable (x) and the dependent variable (y). • It’s on a scale from -1 to 1 with the endpoints representing a perfect linear relationship.

  12. Types of Correlation

  13. This refers back to the problem about weight classes

  14. Let’s try another one! Use it to predict the sodium for 40 g of fat.

  15. Practice Problem • Find equation of the least-squares line. • Find and explain the correlation coefficient, r. • Predict the number of CD’s purchased by a person who is 27 years old. • Find the age of a person who purchased 15 CD’s in the previous year.

More Related