Download
1 / 18
180 likes | 327 Views
zTPFGI Suite Update. 2012. Focus On. Loadsets Loadsets View Shared SOs & Shared Selective Loadsets New Trace Options Trace Store Address Stop Export Data F rom zTREX From Trace Output Viewer Additional Enhancements Overlay Panels for Core Blocks File Compare from Script

E N D
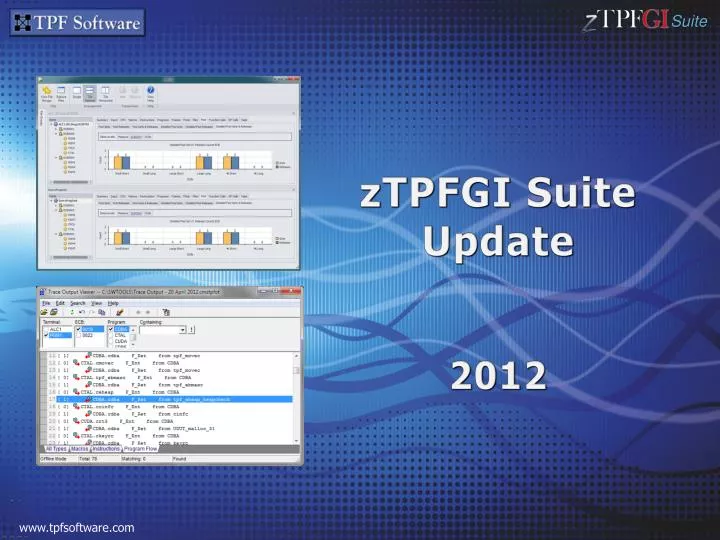
zTPFGI SuiteUpdate 2012
Focus On • Loadsets • Loadsets View • Shared SOs & Shared Selective Loadsets • New Trace Options • Trace Store • Address Stop • Export Data • From zTREX • From Trace Output Viewer • Additional Enhancements • Overlay Panels for Core Blocks • File Compare from Script • More Enhancements
Shared SO & Shared Selective Loadsets • Selective & System-Wide Load • Selective – private, programmer-specific • System-Wide – available to all programmers • What is a Shared SO? • Base/system-wide SOs • What is a Shared Selective Loadset? • Shared private loadsets • Programmer A selectively loads a loadset • Programmer B can view and use Programmer A’s loadset • Only Programmer A can delete their loadset
Loadsets View • Tree-view of available loadsets, SOs and Members • Types of Loadsets • Selective Loadsets • System-wide Loadsets • Shared SOs • Shared Selective Loadsets
Sharing Selective Loadsets: Illustration • Right-click Loadsets View & Select from Menu • Search available loadsets • Select required loadset & Click “Load” • Shared Selective Loadset is added to view
Existing Trace Options • Specify macros or macro groups to trace • Specify which programs to trace
New Trace Option: Trace Store • Specify criteria for tracing • Core Address • Data Level • DECB • ECB Field • File Address • Register
New Trace Option: Address Stop • Stop at specific displacements within programs
Export in zTREX • View required data, then right click & Copy • Paste • Directly into Excel (as CSV) • as HTML • as Plain Text • as Rich Text (RTF) • as XML
Export in Trace Output Viewer • Allows programmers to analyze zTPFGI trace • To export data: • View/Select required data, right click & copy • Paste • Directly into Excel (as CSV) • as HTML • as Plain Text • as Rich Text (RTF) • as XML
Overlay Panels for Core Blocks • What are Overlay Panels? • Apply DSECT panels to core blocks • How it works for users • Core block (XCRW, etc.) • Select panel from gallery • Panel preview on “hover” • After selection, panel applied • Switch back to no panel via tabs • Enhancement • Automatic generation of DSECT panels when build is done
File Compare from Script • What is File Compare? • Quickly diff two text files side-by-side • Move changes from left to right • Compare to remote files, local files or locally saved revisions • Enhancement • Admins writing remote scripts wanted to programmatically start compare & provide files • New API allows this
Many Other Enhancements, Including … • New Trace Options • Trace specific TPFDF macros • Include C function call/return in the ENTER-BACK trace group • zTTFS Enhancements • Works across VPARs on different VM systems • Based on customer request, retrofitted zTTFS to work on TPF 4.1 system • Other • Removed maximum limit of 100 programs in zTREX • Display loadset name of the SO in the call stack panel