Download

1 / 16
160 likes | 448 Views
Chi-Square Test -- X 2. Test of Goodness of Fit. (Pseudo) Random Numbers . Uniform : values conform to a uniform distribution Independent : probability of observing a particular value is independent of the previous values Should always test uniformity. Test for Independence.

E N D
Chi-Square Test -- X2 Test of Goodness of Fit
(Pseudo) Random Numbers • Uniform: values conform to a uniform distribution • Independent: probability of observing a particular value is independent of the previous values • Should always test uniformity
Test for Independence • Autocorrelation Test • Tests the correlation between successive numbers and compares to the expected correlation of zero • e.g. 2 3 2 3 2 4 2 3 • There is a correlation between 2 & 3 • We won’t do this test • software available
Hypotheses & Significance Level • Null Hypotheses – Ho • Numbers are distributed uniformly • Failure to reject Ho shows that evidence of non-uniformity has not been detected • Level of Significance – α (alpha) • α = P(reject Ho|Ho is true)
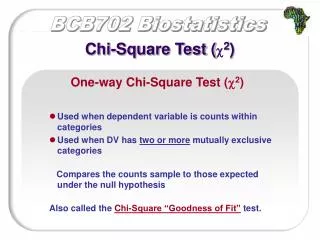
Frequency Tests (Uniformity) • Kolmogorov-Smirnov • More powerful • Can be applied to small samples • Chi Square • Large Sample size >50 or 100 • Simpler test
Overview • Not 100% accurate • Formalizes the idea of comparing histograms to candidate probability functions • Valid for large samples • Valid for Discrete & Continuous
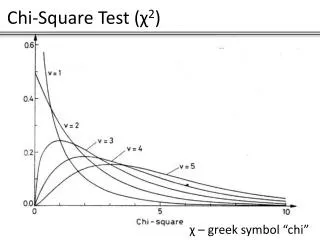
Chi-Square Steps - #1 • Arrange the n observations into k classes • Test Statistic: • X2 = Σ(i=0..k) ( Oi – Ei)2 / Ei • Oi = observed # in ith class • Ei = expected # in ith class • Approximates a X2 distribution with (k-s-1) degrees of freedom
Degrees of Freedom • Approximates a X2 distribution with (k-s-1) degrees of freedom • s = # of parameters for the dist. • Ho: RV X conforms to ?? distribution with parameters ?? • H1: RV X does not conform • Critical value: X2(alpha,dof) from table • Ho reject if X2 > X2(alpha,dof)
X2 Rules • Each Ei > 5 • If discrete, each value should be separate group • If group too small, can combine adjacent, then reduce dof by 1 • Suggested values • n = 50, k = 5 – 10 • n = 100, k = 10 – 20 • n > 100, k = sqrt(n) – n/5
Degrees of Freedom • k – s – 1 • Normal: s=2 • Exponential: s = 1 • Uniform: s = 0
X2 Example • Ho: Ages of MSU students conform to a normal distribution with mean 25 and standard deviation 4. • Calculate the expected % for 8 ranges of width 5 from the mean.
X2 Example • Expected percentages & values • <10-15 = 2.5% 5 • 15-20 = 13.5% 27 • 20-25 = 34% 68 • 25-30 = 34% 68 • 30-35 = 13.5% 27 • 35-40> = 2.5% 5
X2 Example • Consider 200 observations with the following results: • 10-15 = 1 • 15-19 = 70 • 20-24 = 68 • 25-29 = 41 • 30-34 = 10 • 35-40+ = 10
Graph of Data 70 60 50 40 30 20 10 0 10 15 20 25 30 35
X2 Example • X2 Values – (O-E)2/E • 10-15 = (5-1)2/5 3.2 • 15-20 = (27-70) 2/27 68.4 • 20-25 = (68-68) 2/68 0 • 25-30 = (68-41) 2/68 10.7 • 30-35 = (27-10) 2/27 10.7 • 35-40+ = (5-10) 2/4 5 • Total 98
X2 Example • DOF = 6-3 = 3 • Alpha = 0.05 • X2 table value = 7.81 • X2 calculated = 98 • Reject Hypothesis