Download
1 / 12
120 likes | 209 Views
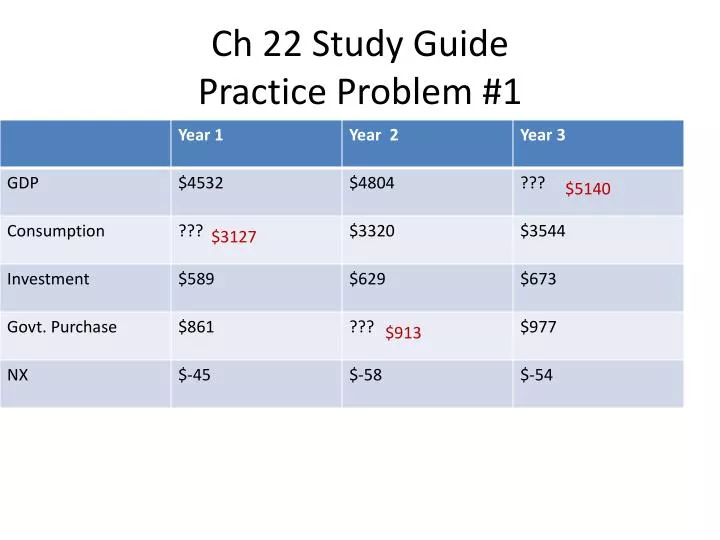
Ch 22 Study Guide Practice Problem #1. $5140. $3127. $913. 1b. Largest expenditure component of GDP? Consumption C. does investment include the purchase of stocks and bonds? Why? No, they are financial transactions. There is no production of goods or services

E N D
Ch 22 Study GuidePractice Problem #1 $5140 $3127 $913
1b. Largest expenditure component of GDP? • Consumption • C. does investment include the purchase of stocks and bonds? Why? • No, they are financial transactions. There is no production of goods or services • D. Do government purchases include government spending on unemployment checks? Why? • No – considered transfer payments. No production or exchange of goods/services • E. What does it mean when NX are negative? • The country imports more goods than it exports • NX = X-M ….so if –NX , then M>X
Practice Problem #2 Year Production of X Price X 2000 20 $5 2001 20 $10 2002 20 $20 a. Nominal GDP (P x Q) b. Real GDP (current year Q x base yr P) • $100 2000 $100 • $200 2001 $100 • $400 2002 $100
Economic Growth? • What does it tell us when NGDP increases? • Could be increase in production • Could be increase in price • Could be combination of production and price • What does it tell us when RGDP increases? • …b/c P is held constant to base year • ….increase is due to increase in Q • ….= ECONOMIC GROWTH
Year Production of X Price X 2000 20 $5 2001 20 $10 2002 20 $20 Nominal GDP (P x Q) Real GDP (current year Q x base yr P) • $100 2000 $100 • $200 2001 $100 • $400 2002 $100 Conclusions??? Economic growth? Price Levels? There was no economic growth. There was only an increase in price level
#3 a. $700 b. $700 Year P soda Q soda P jeans Q jeans NGDP RGDP 2000 $1 200 $10 50 • $1 220 $11 50 Mistake – avoid looking at each individual good – remember this is a model for the entire economy ex of wrong answer: conclude the economy grew for soda but not for jeans……this does not make sense e. Value of GDP Deflator in 2000? NGDP / RGDP x 100 : always 100 in base year f. Value of GDP Deflator in 2001? 770/720 x 100 = 107 GDP = $$$$$$ Deflator is NOT $$ nor %% …IS index based on 100 c. $770 d. $720
g. from 2000-2001: prices rose approximately what percentage? • Compare GDP deflators – measure the change in price level • 2nd -1st / 1st • 107-100/100 = 7% • h. was the increase in NGDP from 2000-01 mostly due to an increase in real output or prices? • NGDP rose from $700 to $770 = 10% increase • Increase in real output = RGDP • 2000=$700 2001 = $720 2.85% (3%) • Increase in prices = Deflator = 7% • Conclude – 10%increase in NGDP was MOSTLY due prices (7%) vs. output (3%)
Evaluate • Was there economic growth? • Yes … • RGDP…. Or • Real output…. Or • ……the economy ……. • Grew at a 3% rate • The growth rate of the economy was 3% ….”normal growth” = 3% per year – long term trend since the 1950’s
………but……… • Price level or inflation increased by 7% • …..not good to have inflation outpace production • “normal” inflation is 1%-2%
#4 Complete Table $100 Year NGDP RGDP GDP Deflator 1. ----- $100 100 2. $120 ---- 120 • $150 $125 ---- Year 1 Math: Nom/Real x 100 = Deflator…$x / $100 x 100 = 100 = NGDP = $100 Year 2 Math: $120 /$x x100 = 120 RGDP = 100 Year 3 Math: $150/$125 x 100 = 120 • What is base year? How can you tell ? If Nom and Real are always same in base year, then GDP Deflator will always be 100 in the base year…..so year 1 is base year $100 120
$100 Year NGDP RGDP GDP Deflator 1. ----- $100 100 2. $120 ---- 120 • $150 $125 ---- b. From year 1 to year 2, did real output rise or did prices rise? Explain The change from year 1 to 2 was due to price rising. The Nom and Deflator rose 20% but Real did not change at all ..indicating no change in output(RGDP measures growth in output) …so prices rose by 20% c. From year 2 to year 3, did real output rise or did prices rise? Explain The change from year 2 to 3 was due to output rising . The Nom and Real both increased by 25% but the Deflator did not change….indicating no change in price….so output rose by 25% $100 120
Year NGDP RGDP GDP Deflator 1. ----- $100 100 2. $120 ---- 120 • $150 $125 ---- $100 $100 120 BONUS: Evaluate the growth of this economy from year 1 to year 3 The economy grew by 25% (based on RGDP) …. …but prices also grew by 20% (based on the deflator)