Download
1 / 14
140 likes | 254 Views
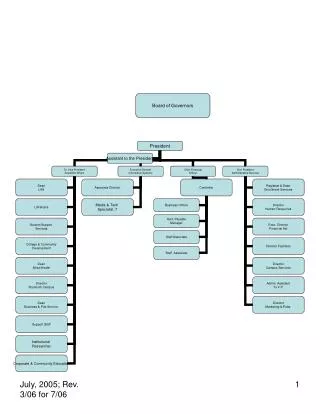
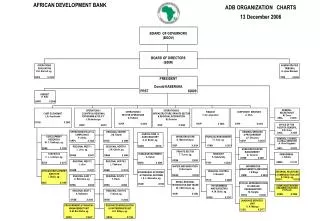
Financial Update Board of Governors Open Session August 8, 2007. Income Statement – Qtr 3, FY 2007. Income Statement – Qtr 3 YTD, FY 2007. Revenue Variance to SPLY. SPLY Change. SPLY Change. Qtr 3 YTD. Qtr 3. First-Class. 23.6B. 73.4B. -1.3%. -1.3%. Standard. 24.6B. 78.3B.

E N D
Financial Update Board of Governors Open Session August 8, 2007
SPLYChange SPLYChange Qtr 3 YTD Qtr 3 First-Class 23.6B 73.4B -1.3% -1.3% Standard 24.6B 78.3B +1.8% -0.9% Periodicals 2.3B 6.7B -2.7% -0.5% Express 14M 42M -1.3% -0.5% Priority 215M 696M -2.4% -2.8% Package Svc. 258M 879M -0.3% +0.8% Total All Mail 51.4B 161.5B +0.2% -1.3% Volume Performance
Qtr 3 YTD Qtr 3 Transportation +$448 +$39 Salaries & Benefits +1,008 +99 Foreign Postal Settlements +79 +76 +36 Supplies & Services -24 +263 +183 Other Total Expense Variance +$1,834 +$373 Expense Variance to SPLY ($ in Millions)
Qtr 3 YTD SPLY Qtr 3 Qtr 3 YTD -0.3% Workload +0.3% +1.2% -2.1% Resources -1.2% +0.6% +1.8% Total Factor Productivity +1.4% +0.5% Total Factor Productivity
FY Total Mail Volume per Workhour 22 Million New Delivery Points Added During This Period * YTD June
Nine Months Ended June 30, 2007 Nine Months Ended June 30, 2006 Beginning of Year: Cash Unrestricted $ 997 $ 930 Cash Restricted 2,958 --- Cash Flows from Operations: 3,849 3,745 (1,713) (1,743) Cash Flows from Investing Activities Free Cash Flow 2,106 2,032 Cash Flows from Financing Activities 93 (93) Payment of Debt (2,100) --- Payment of 2006 Escrow to HB Fund (2,958) --- Net Change in Cash (2,859) 1,939 Cash at End of Period $1,096 $2,869 Statements of Cash Flows ($ in Millions)
FY 2007 Debt through Quarter 3 YTD ($ Billions) Beginning Debt $2.1 Payment of Debt -$2.1 Ending Debt $0.0
Risks to Outlook for Quarter 4 • Economy • Impact from May Rate Increase • Labor Agreements • Workers Compensation Liability
Financial Update Board of Governors Open Session August 8, 2007