Download
1 / 10
190 likes | 1.09k Views
Interpreting Graphic Aids. Reading I,II,III. Graphic Aids. Provide visual explanations of concepts and relationships. Easier to understand than words alone. Enables students to grasp and recall information easily.

E N D
Interpreting Graphic Aids Reading I,II,III
Graphic Aids • Provide visual explanations of concepts and relationships. • Easier to understand than words alone. • Enables students to grasp and recall information easily. • Authors mention graphic aids at a point in which they think the graph will help the reader.
Steps in Reading a Table or Graph 1. Read the title/topic. Title explains what part of the graph is clarified or illustrated. What is the title/topic of this graph? STAGES OF SLEEP Stages of sleep
Steps in Reading a Table or Graph 2. Read the source to check if information is current and reliable. What is the source of this graph? Dianne Hales, An Invitation to Health, 11th edition Source: Dianne Hales, An Invitation to Health, 11th edition
Steps in Reading a Table or Graph 3 Examine the units of measure. Read any captions at the top, the side, or underneath that tell exactly what each column, line, bar, number, or other item represents. Awake Periods of rapid eye movement Captions Stage of sleep Body activity Time (hours)
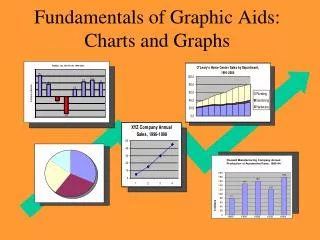
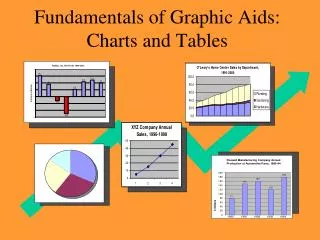
Bar Graph • Length of parallel bars are used to make comparisons • Bars in graphs can either be vertical or horizontal. .
Line Graphs • Points are connected to show relationships between two or more items. • There may be one or more lines depending on the items.
Pie Charts • Circle graph in which the sizes of the slices presents part of a whole.
Flowcharts/Mapping • Shows steps in procedures or processes • Uses boxes or other shapes connected by lines or arrows.
Tables/Charts • Systematic listing of data in rows or columns. Number of Cars Sold for the Month of February by Week FAVORITE PETS OF STUDENTS