Download

1 / 36
520 likes | 1.09k Views
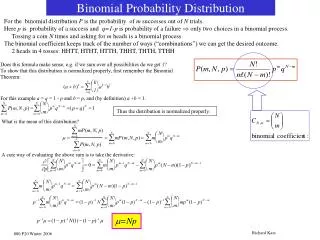
Probability Distribution. Binomial Distribution. Probability of Binary Events. Probability of success = p p(success) = p Probability of failure = q p(failure) = q p+q = 1 q = 1-p. Binomial Probability Distribution. A fixed number of observations (trials), n

E N D
Probability Distribution Binomial Distribution
Probability of Binary Events • Probability of success = p • p(success) = p • Probability of failure = q • p(failure) = q • p+q = 1 • q = 1-p
Binomial Probability Distribution • A fixed number of observations (trials), n • e.g., 15 tosses of a coin; 20 patients; 1000 people surveyed • A binary random variable • e.g., head or tail in each toss of a coin; defective or not defective light bulb • Generally called “success” and “failure” • Probability of success is p, probability of failure is 1 – p • Constant probability for each observation • e.g., Probability of getting a tail is the same each time we toss the coin
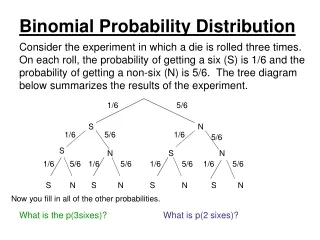
Binomial example Take the example of 5 coin tosses. What’s the probability that you flip exactly 3 heads in 5 coin tosses?
Binomial distribution Solution: One way to get exactly 3 heads: HHHTT What’s the probability of this exact arrangement? P(heads)xP(heads) xP(heads)xP(tails)xP(tails) =(1/2)3x(1/2)2 Another way to get exactly 3 heads: THHHT Probability of this exact outcome = (1/2)1x (1/2)3x(1/2)1 = (1/2)3x(1/2)2
Binomial distribution Solution: In fact, (1/2)3x(1/2)2 is the probability of each unique outcome that has exactly 3 heads and 2 tails. So, the overall probability of 3 heads and 2 tails is: (1/2)3x(1/2)2 + (1/2)3x(1/2)2+ (1/2)3x(1/2)2+ ….. for as many unique arrangements as there are—but how many are there??
Outcome Probability THHHT (1/2)3x(1/2)2 HHHTT (1/2)3x(1/2)2 TTHHH (1/2)3x(1/2)2 HTTHH (1/2)3x(1/2)2 HHTTH (1/2)3x(1/2)2 THTHH (1/2)3x(1/2)2 HTHTH (1/2)3x(1/2)2 HHTHT (1/2)3x(1/2)2 THHTH (1/2)3x(1/2)2 HTHHT (1/2)3x(1/2)2 10 arrangements x (1/2)3x(1/2)2 The probability of each unique outcome (note: they are all equal) ways to arrange 3 heads in 5 trials 5C3 = 5!/3!2! = 10
P(3 heads and 2 tails) = x P(heads)3 x P(tails)2 = • 10 x (½)5=31.25%
Example 2 As voters exit the polls, you ask a representative random sample of 6 voters if they voted for proposition 100. If the true percentage of voters who vote for the proposition is 55.1%, what is the probability that, in your sample, exactly 2 voted for the proposition and 4 did not?
ways to arrange 2 Obama votes among 6 voters P(2 yes votes exactly) = x (.551)2x(.449)4= 18.5% Solution: Outcome Probability YYNNNN = (.551)2x(.449)4 NYYNNN (.449)1x (.551)2x(.449)3= (.551)2x(.449)4 NNYYNN (.449)2x (.551)2x(.449)2= (.551)2x(.449)4 NNNYYN (.449)3x (.551)2x(.449)1= (.551)2x(.449)4 NNNNYY (.449)4x (.551)2= (.551)2x(.449)4 . . 15 arrangements x (.551)2x(.449)4
n = number of trials 1-p = probability of failure p = probability of success X = # successes out of n trials Binomial distribution, generally Note the general pattern emerging if you have only two possible outcomes (call them 1/0 or yes/no or success/failure) in n independent trials, then the probability of exactly X “successes”=
Definitions: Binomial • Binomial: Suppose that n independent experiments, or trials, are performed, where n is a fixed number, and that each experiment results in a “success” with probability p and a “failure” with probability 1-p. The total number of successes, X, is a binomial random variable with parameters n and p. • We write: X ~ Bin (n, p) {reads: “X is distributed binomially with parameters n and p} • And the probability that X=r (i.e., that there are exactlyr successes) is:
Definitions: Bernouilli Bernouilli trial: If there is only 1 trial with probability of success p and probability of failure 1-p, this is called a Bernouilli distribution. (special case of the binomial with n=1) Probability of success: Probability of failure:
Binomial distribution: example • If I toss a coin 20 times, what’s the probability of getting exactly 10 heads?
Binomial distribution: example • If I toss a coin 20 times, what’s the probability of getting of getting 2 or fewer heads?
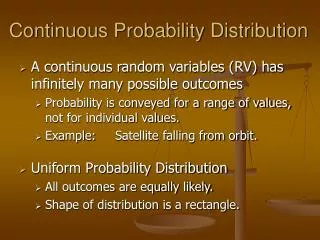
Introduction to the Poisson Distribution • Poisson distribution is for counts—if events happen at a constant rate over time, the Poisson distribution gives the probability of X number of events occurring in time T.
Poisson Mean and Variance • Mean For a Poisson random variable, the variance and mean are the same! • Variance and Standard Deviation where = expected number of hits in a given time period
Poisson Distribution The Poisson distribution is used to model the number of events occurring within a given time interval. The formula for the Poisson probability density (mass) function is is the shape parameter which indicates the average number of events in the given time interval.
Example Arrivals at a bus-stop follow a Poisson distribution with an average of 4.5 every quarter of an hour. Obtain a barplot of the distribution (assume a maximum of 20 arrivals in a quarter of an hour) and calculate the probability of fewer than 3 arrivals in a quarter of an hour.
The probabilities of 0 up to 2 arrivals can be calculated directly from the formula with =4.5 So p(0) = 0.01111
Similarly p(1)=0.04999 and p(2)=0.11248 So the probability of fewer than 3 arrivals is 0.01111+ 0.04999 + 0.11248 =0.17358
Poisson Distribution, example The Poisson distribution models counts, such as the number of new cases of SARS that occur in women in New England next month. The distribution tells you the probability of all possible numbers of new cases, from 0 to infinity. If X= # of new cases next month and X ~ Poisson (), then the probability that X=k (a particular count) is:
Example • For example, if new cases of West Nile Virus in New England are occurring at a rate of about 2 per month, then these are the probabilities that: 0,1, 2, 3, 4, 5, 6, to 1000 to 1 million to… cases will occur in New England in the next month:
X P(X) 0 =.135 1 =.27 2 =.27 3 =.18 4 =.09 5 … … Poisson Probability table
Properties of Poisson The mean and variance are both equal to . The sum of independent Poisson variables is a further Poisson variable with mean equal to the sum of the individual means. As well as cropping up in the situations already mentioned, the Poisson distribution provides an approximation for the Binomial distribution.
Simulation“Discrete-Event System Simulation” Statistical Models in Simulation
Purpose & Overview • The world the model-builder sees is probabilistic rather than deterministic. • Some statistical model might well describe the variations. • An appropriate model can be developed by sampling the phenomenon of interest: • Select a known distribution through educated guesses • Make estimate of the parameters • Test for goodness of fit
Review of Terminology and Concepts • In this section, we will review the following concepts: • Discrete random variables • Cumulative distribution function
Useful Statistical Models • In this section, statistical models appropriate to some application areas are presented. • The areas include: • Queueing systems • Inventory and supply-chain systems • Reliability and maintainability • Limited data
Useful models – Queueing Systems • In a queueing system, interarrival and service-time patterns can be probabilistic. • Sample statistical models for interarrival or service time distribution: • Exponential distribution: if service times are completely random • Normal distribution: fairly constant but with some random variability (either positive or negative) • Truncated normal distribution: similar to normal distribution but with restricted value. • Gamma and Weibull distribution: more general than exponential • (involving location of the modes of pdf’s and the shapes of tails.)
Useful models – Inventory and supply chain • In realistic inventory and supply-chain systems, there are at least three random variables: • The number of units demanded per order or per time period • The time between demands • The lead time = Time between placing an order and the receipt of that order • Sample statistical models for lead time distribution: • Gamma • Sample statistical models for demand distribution: • Poisson: simple and extensively tabulated. • Negative binomial distribution: longer tail than Poisson (more large demands). • Geometric: special case of negative binomial given at least one demand has occurred.
Useful models – Reliability and maintainability • Time to failure (TTF) • Exponential: failures are random • Gamma: for standby redundancy where each component has an exponential TTF • Weibull: failure is due to the most serious of a large number of defects in a system of components • Normal: failures are due to wear
Useful models – Other areas • For cases with limited data, some useful distributions are: • Uniform • Triangular • Beta • Other distribution: • Bernoulli • Binomial • Hyperexponential