Download
1 / 7
110 likes | 1.16k Views
Probability Distribution. The probability distribution for a random variable is an assignment of probability to each of the possible values for the variable. Probability Distributions. Discrete Probability Distributions 1. The Uniform Distribution; 2. The Binomial Distribution;

E N D
Probability Distribution The probability distribution for a random variable is an assignment of probability to each of the possible values for the variable
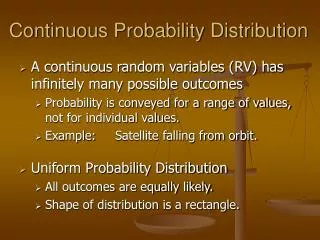
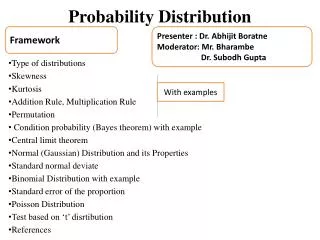
Probability Distributions • Discrete Probability Distributions • 1. The Uniform Distribution; • 2. The Binomial Distribution; • 3. The Hypergeometric Distribution; and • 4. The Poisson Distribution • Continuous Probability Distributions • 1. The Uniform Distribution; and • 2. The Normal Distribution
Mean of a Discrete Probability Distribution The mean of a discrete probability distribution is also called the expected value of the discrete random variable. where, E(X) = expected value of X X = values of the random variable P(X) = probability of each value of X
Standard Deviation of a Discrete Probability Distribution • Standard Deviation of a discrete random variable where, X = values of the random variable E(X) = expected value of X P(X) = probability of each value of X
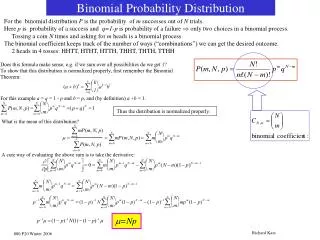
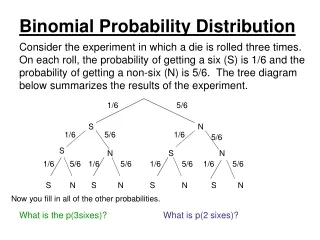
The Binomial or Bernoulli Process • The experiment consists ofn identical trials; • Each trial results in one of two outcome, success or failure; • The probability of success on a single trial is equal to p, and remains the same from trial to trial. The probability of failure is ( 1 - p ); • The trials are independent; and • The experimenter is interested in X, the number of successes observed during the n trials.
Example: Taste Test; Coke Vs. PepsiSample size (n) = 3, P(Coke is preferred) = 0.20 Simple Consumer Event One TwoThree P(ei)_ ___ e1 C C C (0.20)3 = 0.008 e2 C C P (0.20)2(0.80) = 0.032 e3 C P C (0.20)2(0.80) = 0.032 e4 C P P (0.20)(0.80)2 = 0.128 e5 P C C (0.20)2(0.80) = 0.032 e6 P C P (0.20)(0.80)2 = 0.128 e7 P P C (0.20)(0.80)2 = 0.128 e8 P P P (0.80)3 = 0.512 1.000
Probability Distribution Coke Vs. Pepsi _X_ ___ei___ _P(X)_ 0 e8 0.512 1 e4,e6,e7 0.384 2 e2,e3,e5 0.096 3 e10.008 1.000