Download
1 / 10
110 likes | 273 Views
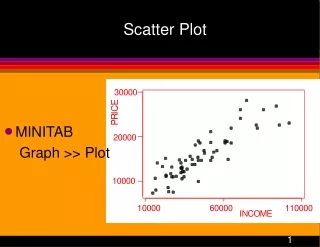
Scatter Plot Applications. Scatterplot #1. Find the equation of the line of best fit. Use the two points in red Using the equation, predict how many typos would be in a book with 20 chapters. Show your work.

E N D
Scatterplot #1 • Find the equation of the line of best fit. • Use the two pointsin red • Using the equation, predict how many typos would be in a book with 20 chapters. Show your work. • Using the equation, if 20 typos were found, about how many chapters would be in the book?
Scatterplot #2 • Find the equation of the line of best fit. • Use the two points: • (80, 5) and (90, 6) • Using the equation, predict how much weight would be lost in 100 days. Show your work. • Using the equation, if about 10 pounds were lost, about how many days would it take? Weight Loss vs. Length of time
Scatterplot #3 • Find the equation of the line of best fit. • Use the two points: • (0, 10) and (12,2) • 2. Using the equation, predict how much your car would be worth when it is 6 years old. Show your work. • HINT: When the value is 4 = $4,000 • 3. Using the equation, if your car is worth about $4,000, how old is it? Value of Car by Age Value of Car (thousands of dollars) Age of Car (years)
Scatterplot #4 • Find the equation of the line of best fit. • Use the two points: • (35, 72) and (42, 78) • Using the equation, predict what your percentage would be if you spent 56 min on the exam. Show your work. • Using the equation, if you have an 84% about how much time did you spend on the exam?
Scatterplot #5 • Find the equation of the line of best fit. • Use the two points: • (2,000, 5) and (1,000, 15) • Using the equation, predict what your elevation would be if the average annual temperature is 10 degrees. Show your work. • Using the equation, if you were at 1,000 m elevation, about what would the annual temperature be?
Scatterplot #6 Given the scenario, identify whether it would be positive, negative, or no correlation between the two variables. Prove it by sketching a scatterplot. a. study time, higher grades b. height, intelligence c. shoe size, salary d. age of car, value of car
Scatterplot #7 • Plot the data and determine whether the correlation is positive, negative, or no correlation.
Scatterplot #8 • Plot the data and determine whether the correlation is positive, negative, or no correlation.
Scatterplot #9 • Plot the data and determine whether the correlation is positive, negative, or no correlation.